

Available with these plans:
Starter
Basic
Pro
Enterprise
1
1
200
200
The above is the number of data tables that can be added to a single dashboard block. The multiple data source feature is available on Pro and above plans. To upgrade your Lark Plan or for more information, contact Support or your Customer Success Manager. The Lark Basic plan supports only specific countries and regions.
I. Intro
When adding or configuring blocks in Base dashboards, you can select multiple data sources for more comprehensive, in-depth data analysis across different tables.
Use cases:
Link multiple tables to calculate the sum or average of data in the same category.
For example, you recorded sales data for each quarter of last year in four different tables in the base, and you want to calculate the annual sales volume for each region. You can link these four tables in a dashboard chart, select the sales region as the category, and select the sales volume as the field summary.
If the tables contain the same regions, the sum will be calculated. If the tables contain different regions, new categories will be added.
250px|700px|reset
250px|700px|reset
II. Steps
Note: This article only covers how to set up multiple data sources for a chart. For configuration instructions for each chart type, refer to the corresponding articles.
- Open the base and click Dashboard on the left navigation bar.
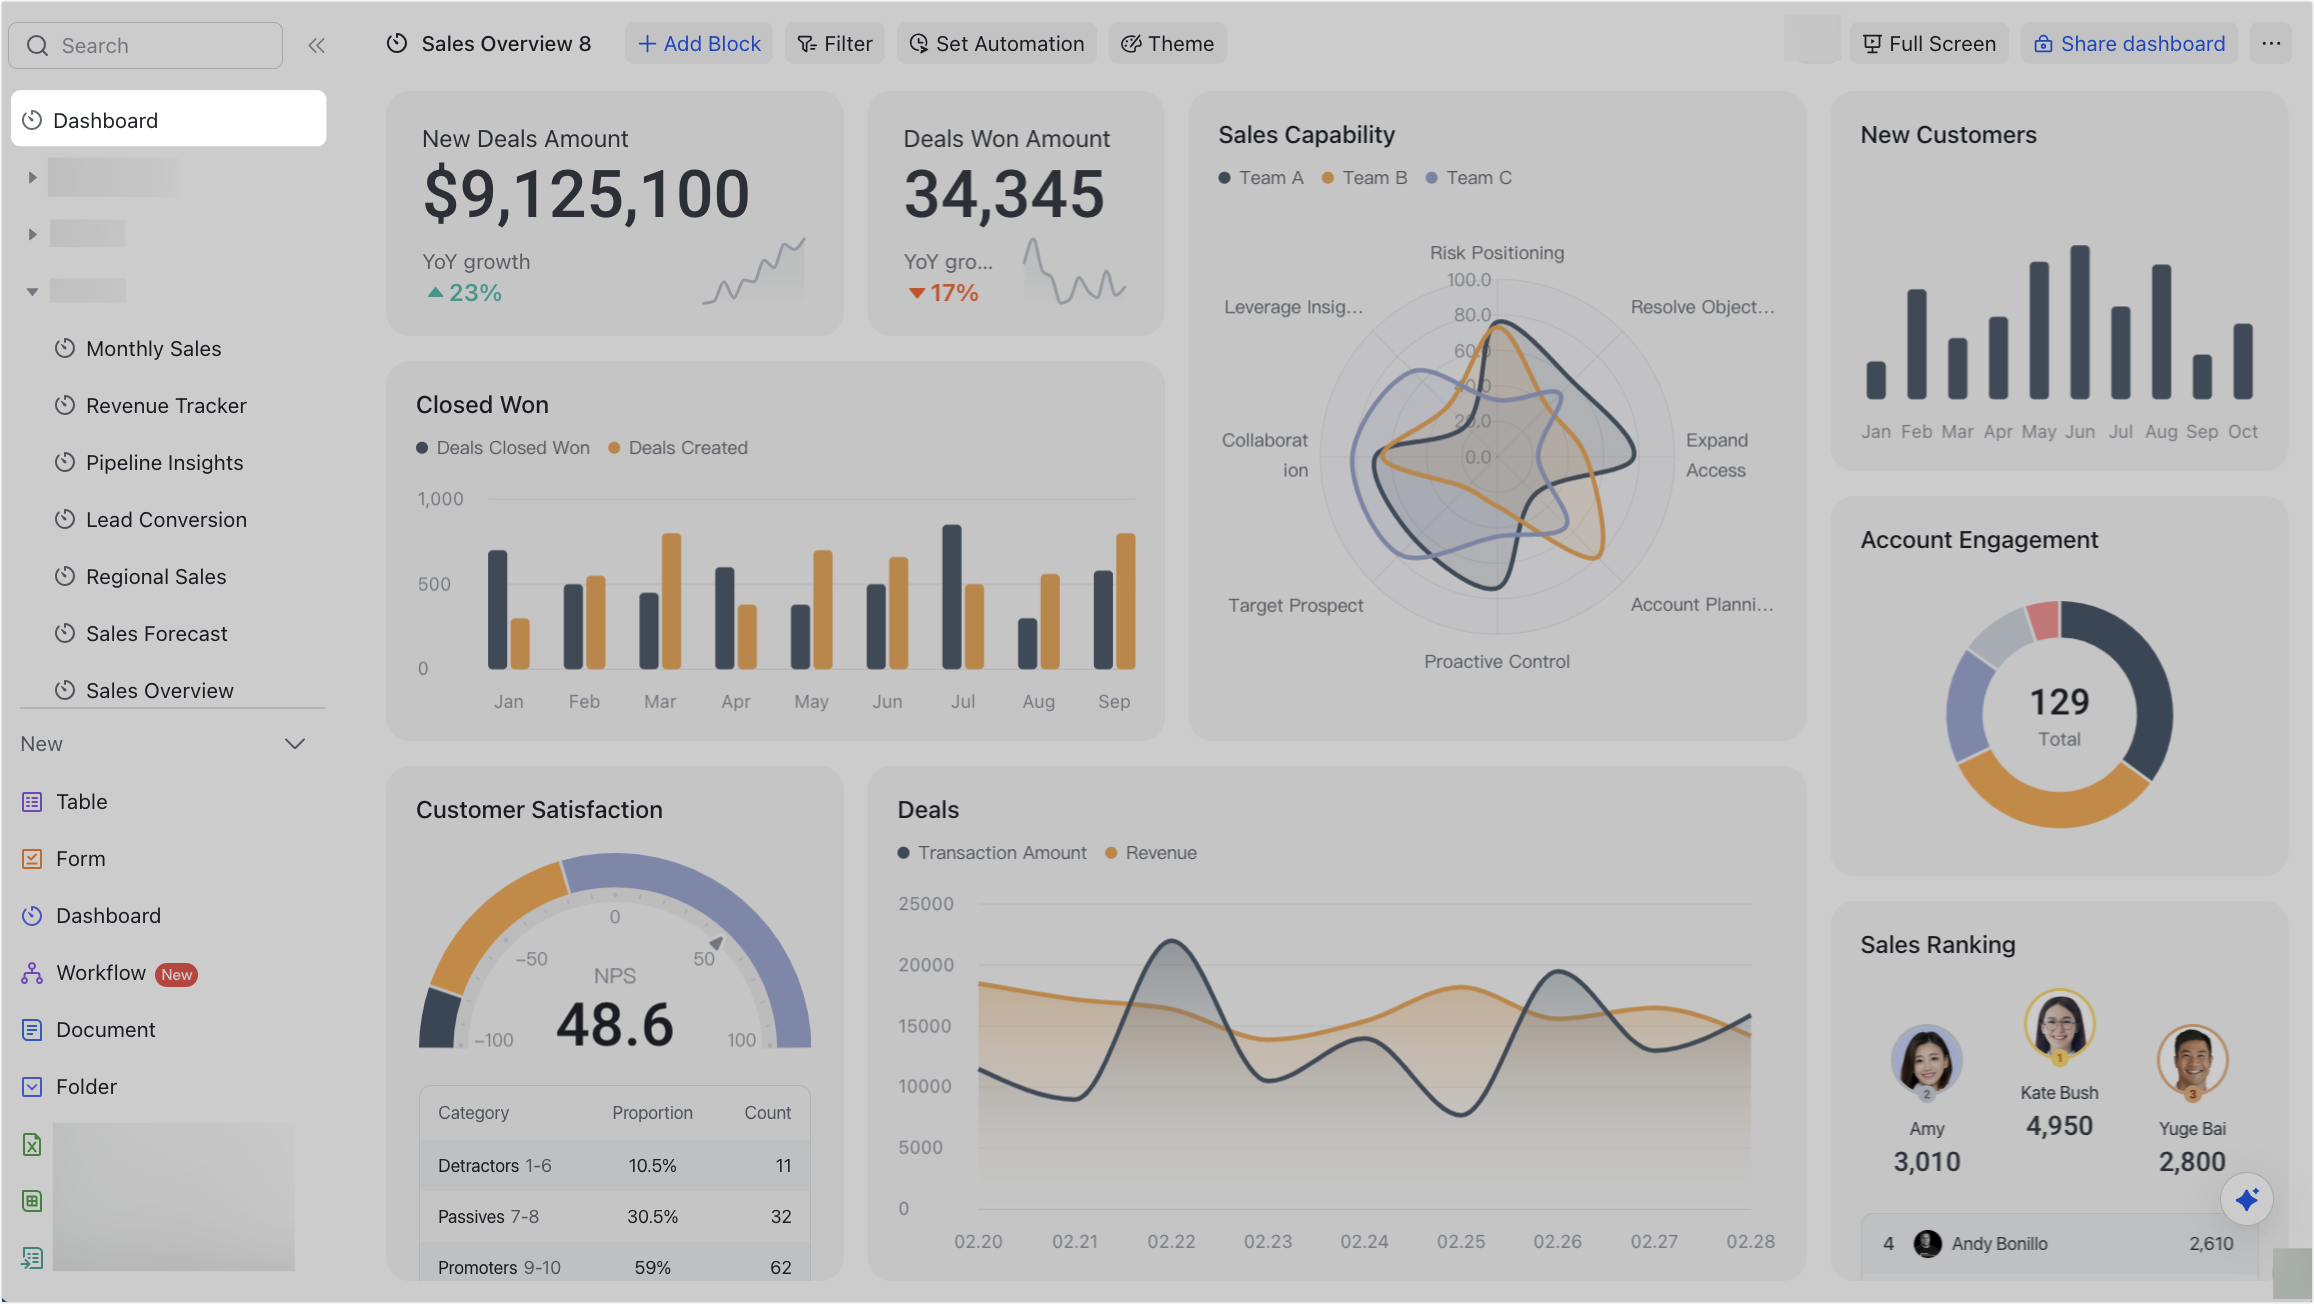
250px|700px|reset
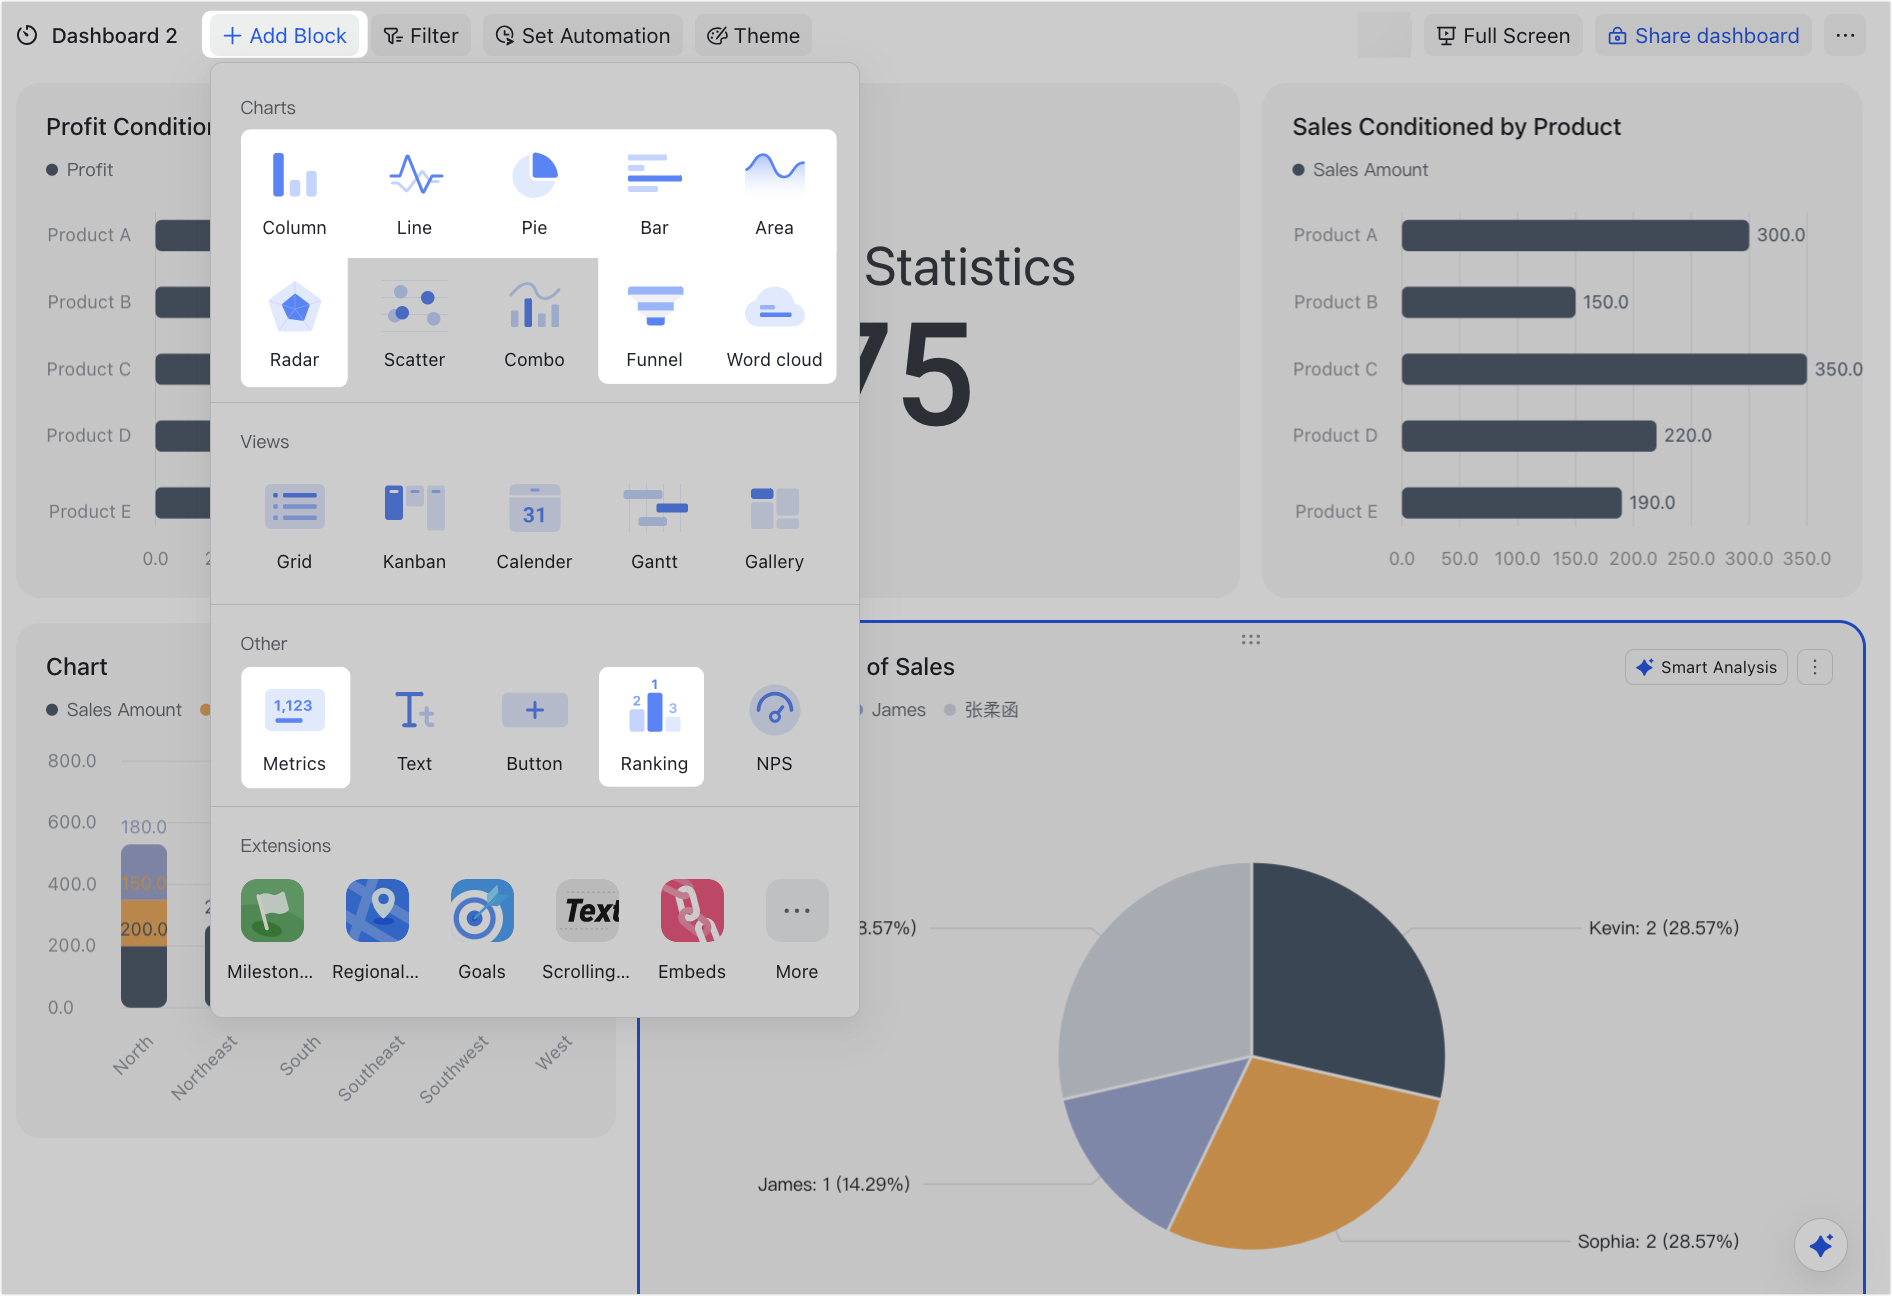
- Click Add Block and select a block type, or click the ⋮ icon in the upper-right corner of an existing block and select Configure.
- Note: Blocks that support multiple data sources include charts with X and Y axes (column charts, line charts, bar charts, scatter charts, combo charts, and area charts), pie charts, funnel charts, word clouds, radar charts, metrics blocks, and ranking blocks.

250px|700px|reset
250px|700px|reset
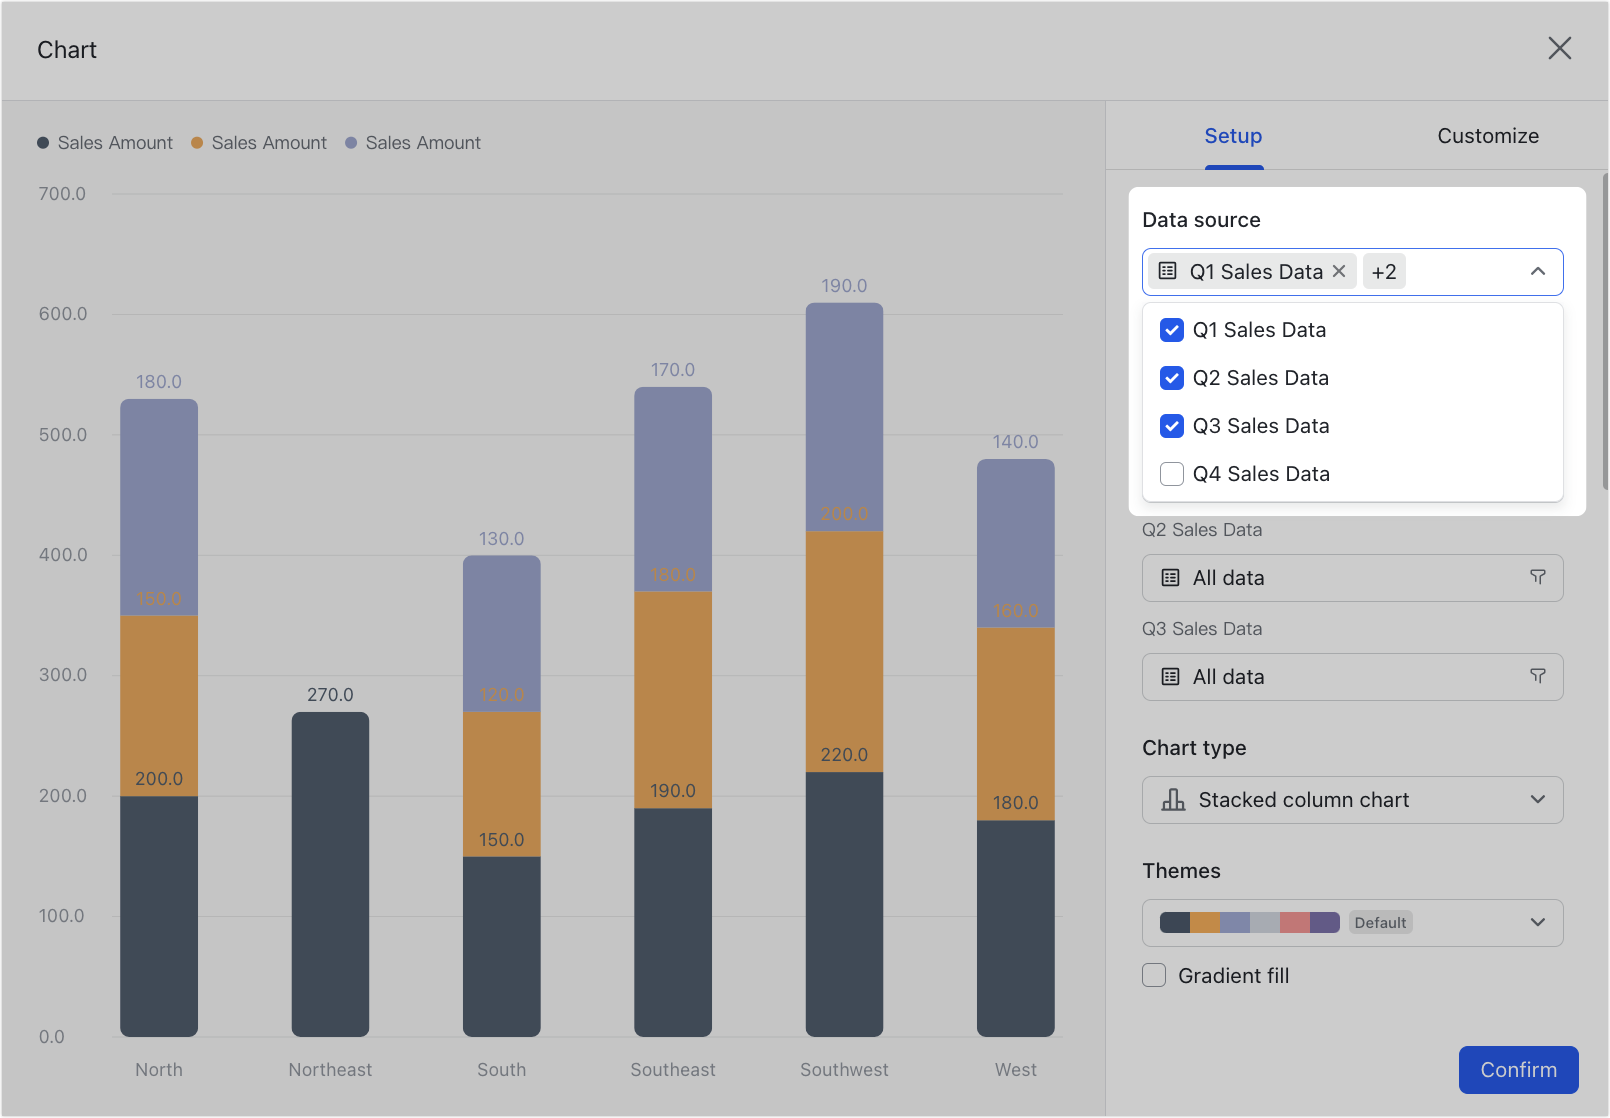
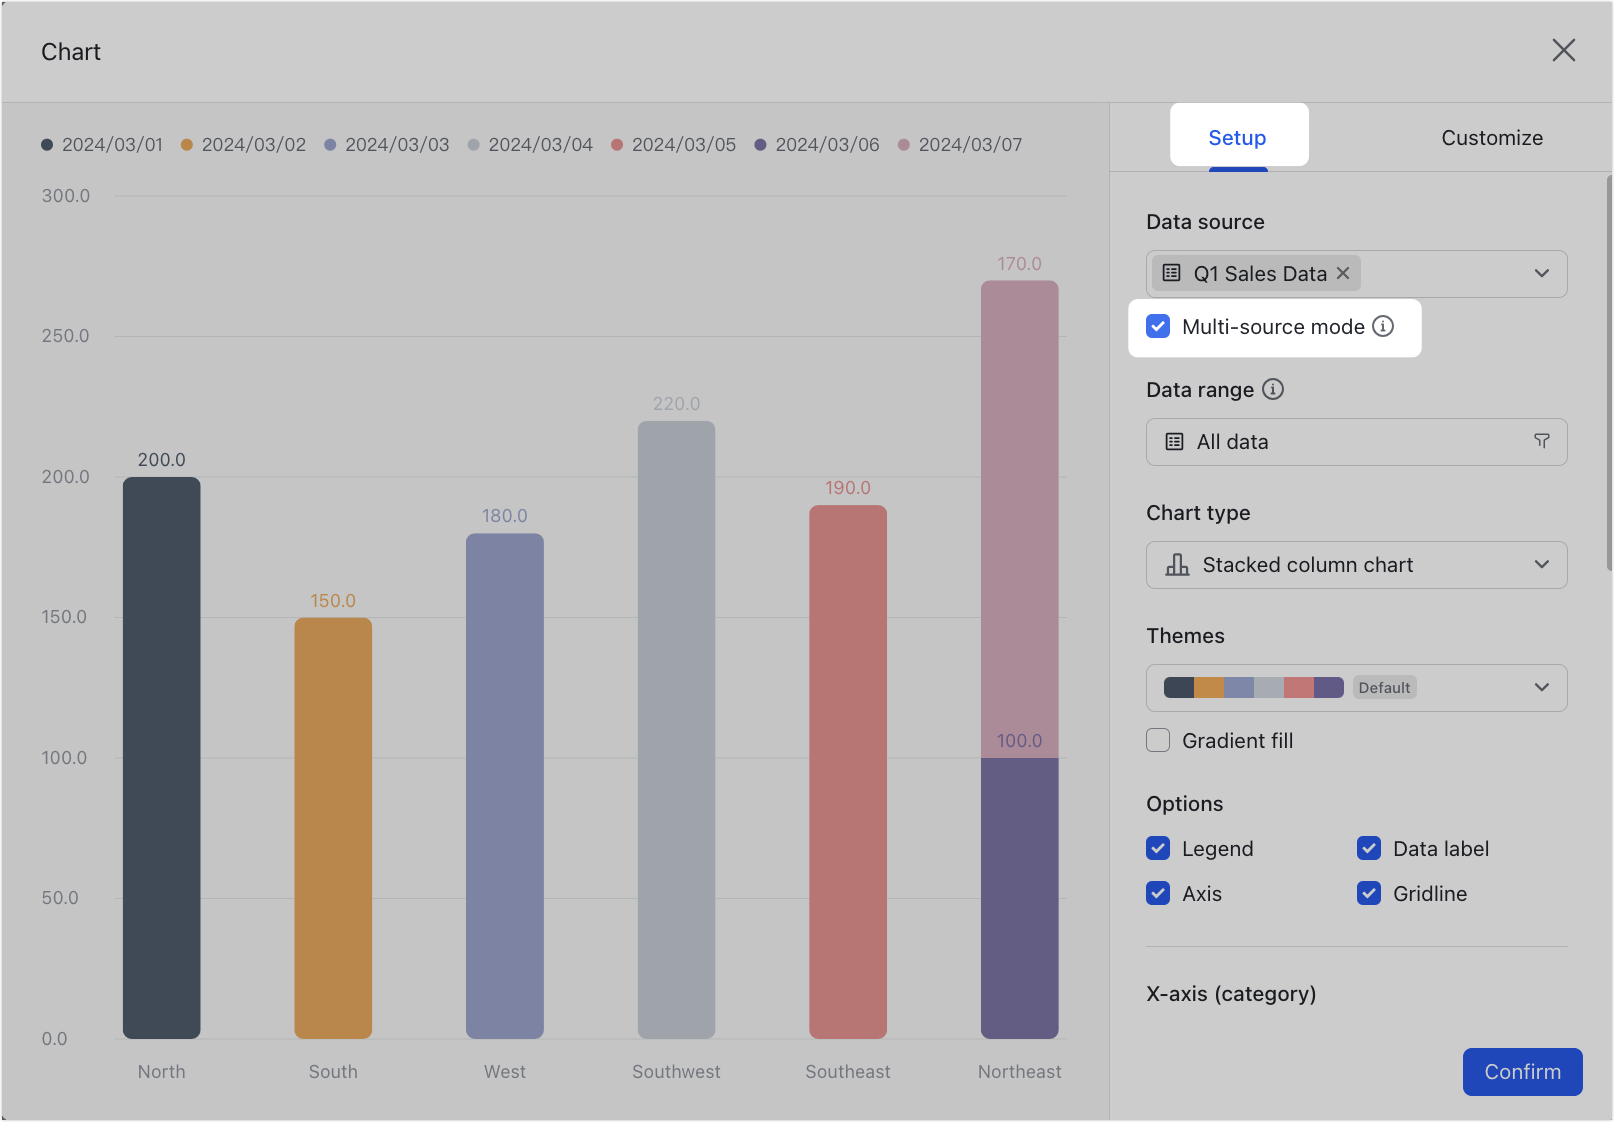
- On the Setup tab, select Multi-source mode under Data source to select multiple tables as the data source.
250px|700px|reset
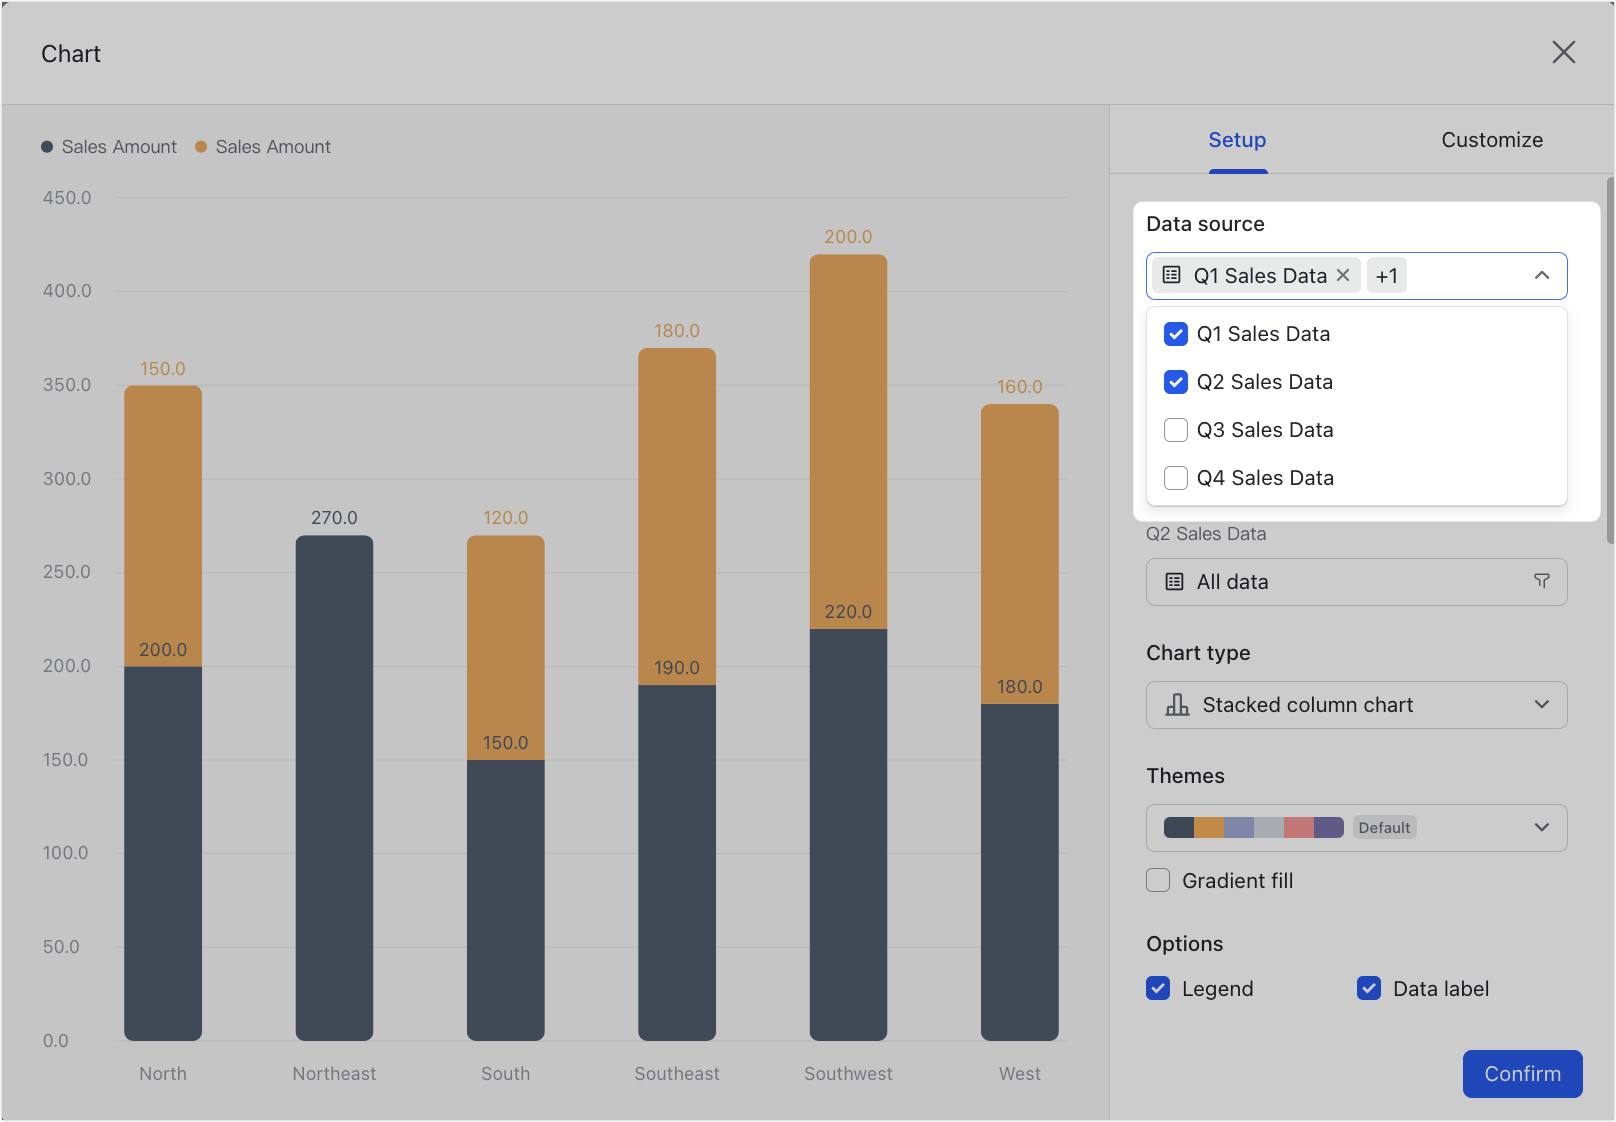
Charts with X and Y axes
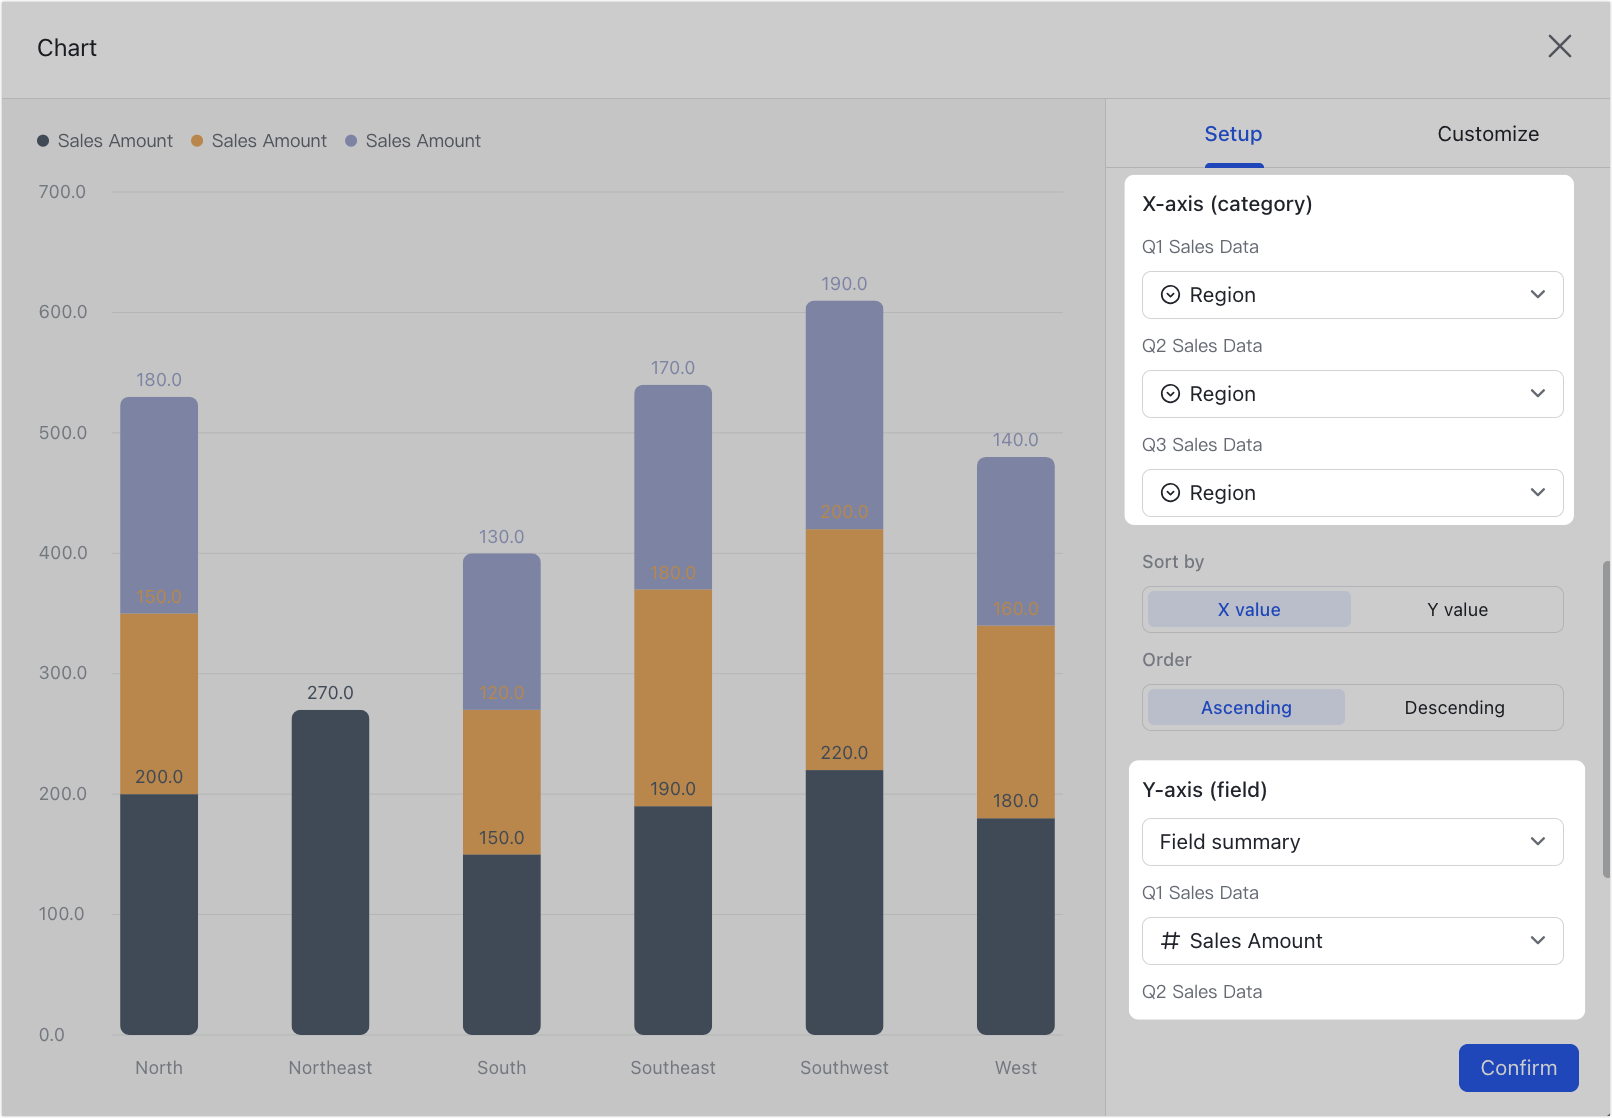
When you select multiple data sources for a chart with X and Y axes, you can configure the following settings:
- Data range: Select which view to use and set filter conditions for each data source.
- X-axis (category): Select the data fields to display for each data source. The fields you select from different data sources must be of the same type. If you change the fields for one data source, the other data sources will automatically switch to fields of the same type. If a data source has no fields of the same type, no fields will be selected.
- Y-axis (field): You can select Number of records (default) or Field summary.
- Number of records: This will calculate the total number of records in the data sources.
- Field summary: This can only be selected if there are number or formula fields in the tables. Only one number field can be selected for each data source. The available calculation methods include Sum, Max, Min, or Average.
- Group by: If multiple data sources are selected, then this option won't be available.
- Group by X-axis: This option is only available if you have selected multiple data sources. It is selected by default and the data from the different data sources is grouped into a series by the X-axis.
Note: Charts with X and Y axes include column charts, line charts, bar charts, scatter charts, combo charts, and area charts.
250px|700px|reset
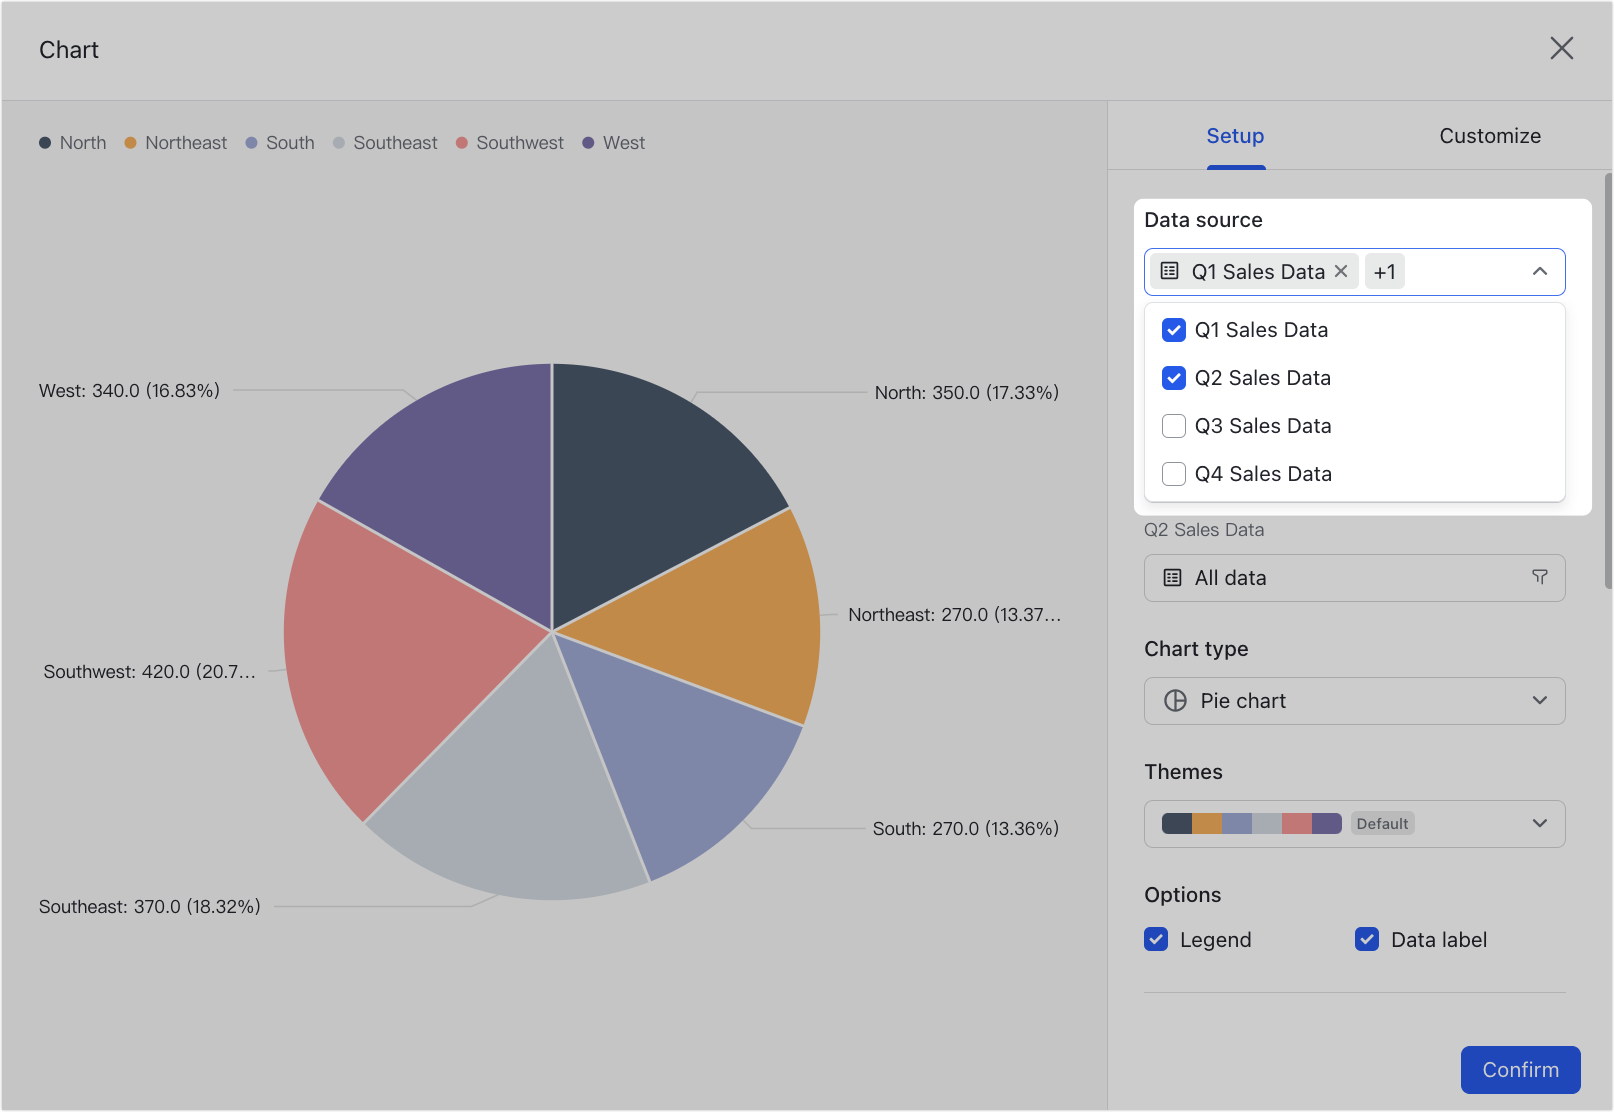
Pie charts
When you select multiple data sources for a pie chart, you can configure the following settings:
- Data range: Select which view to use and set filter conditions for each data source.
- Pie slices: Select the fields for each data source. The fields you select from different data sources must be of the same type. If you change the fields for one data source, the other data sources will automatically switch to the fields of the same type. If a data source has no fields of the same type, no fields will be selected.
- Slice values: You can select Number of records (default) or Field summary.
- Number of records: This will calculate the total number of records in the data sources when multiple data sources are selected.
- Field summary: This can only be selected if there are number or formula fields in the tables. Only one number field can be selected for each data source. The available calculation methods include Sum, Max, Min, or Average.
250px|700px|reset
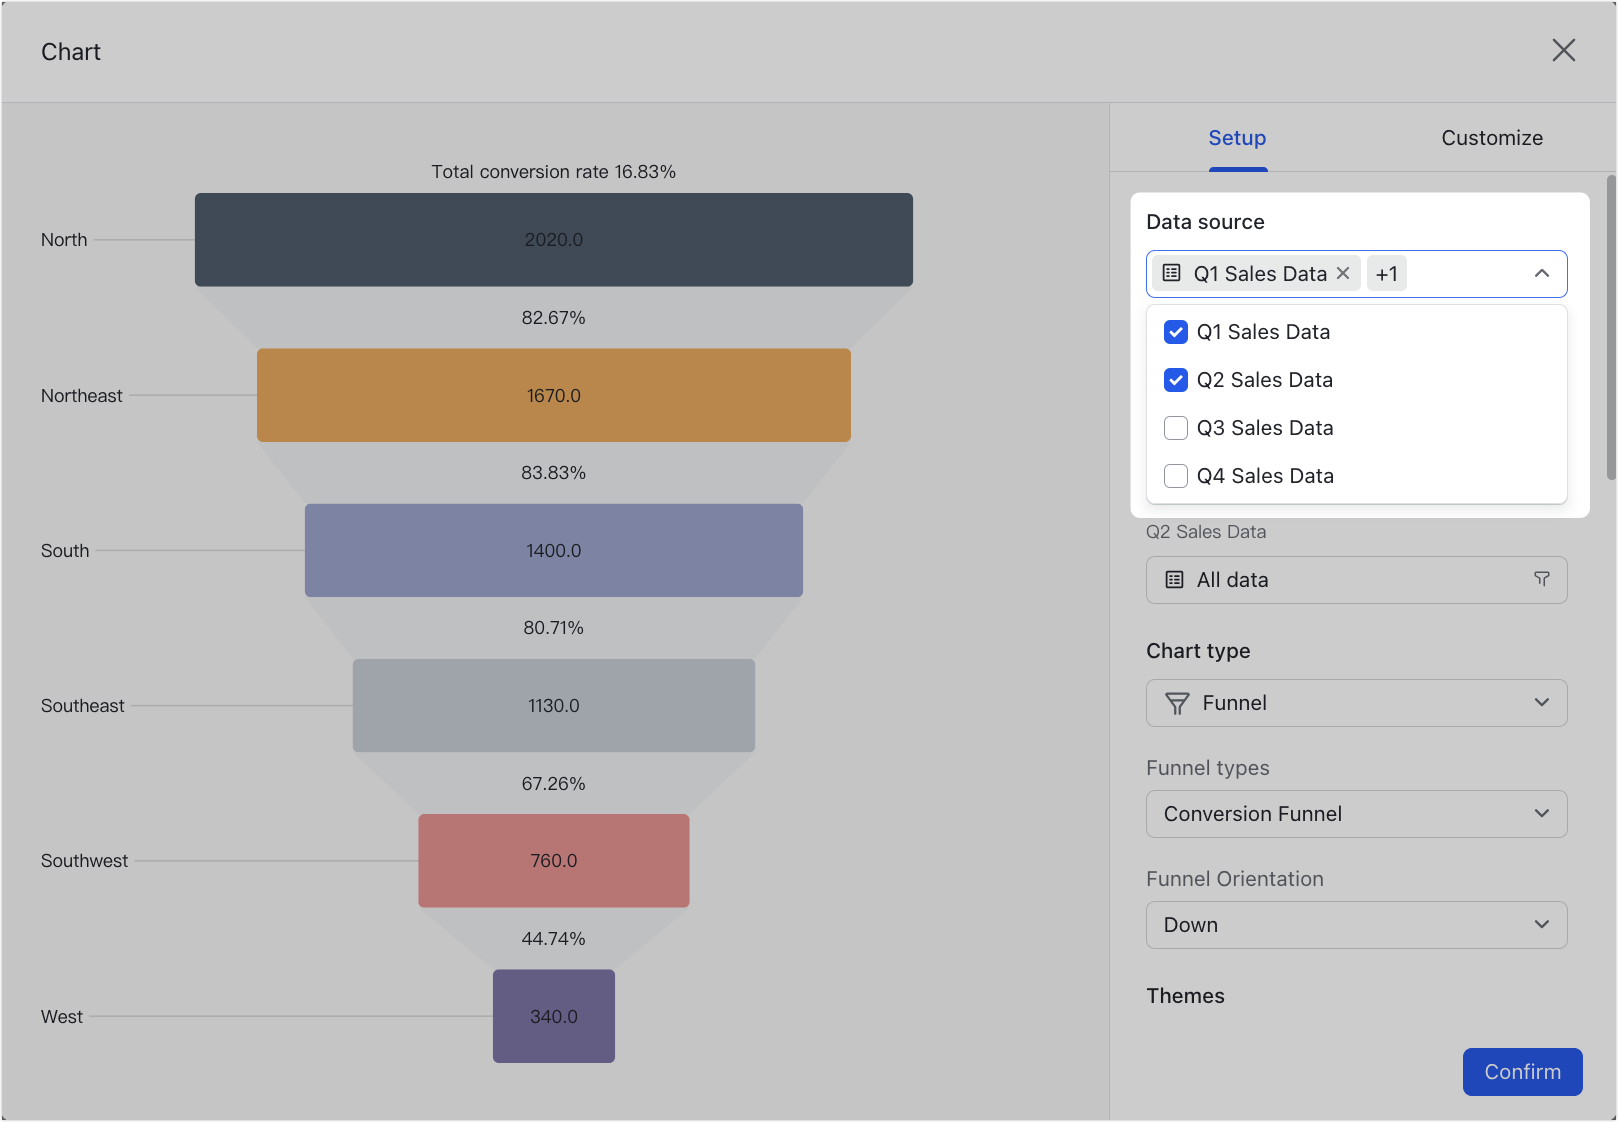
Funnel charts
When you select multiple data sources for a funnel chart, you can configure the following settings:
- Data range: Select which view to use and set filter conditions for each data source.
- Funnel bar: Select the fields for each data source. The fields you select from different data sources must be of the same type. If you change the fields for one data source, the other data sources will automatically switch to the fields of the same type. If a data source has no fields of the same type, no fields will be selected.
- Value: You can select Number of records (default) or Field summary.
- Number of records: This will calculate the total number of records in the data sources when multiple data sources are selected.
- Field summary: This can only be selected if there are number or formula fields in the tables. Only one number field can be selected for each data source. The available calculation methods include Sum, Max, Min, or Average.
250px|700px|reset
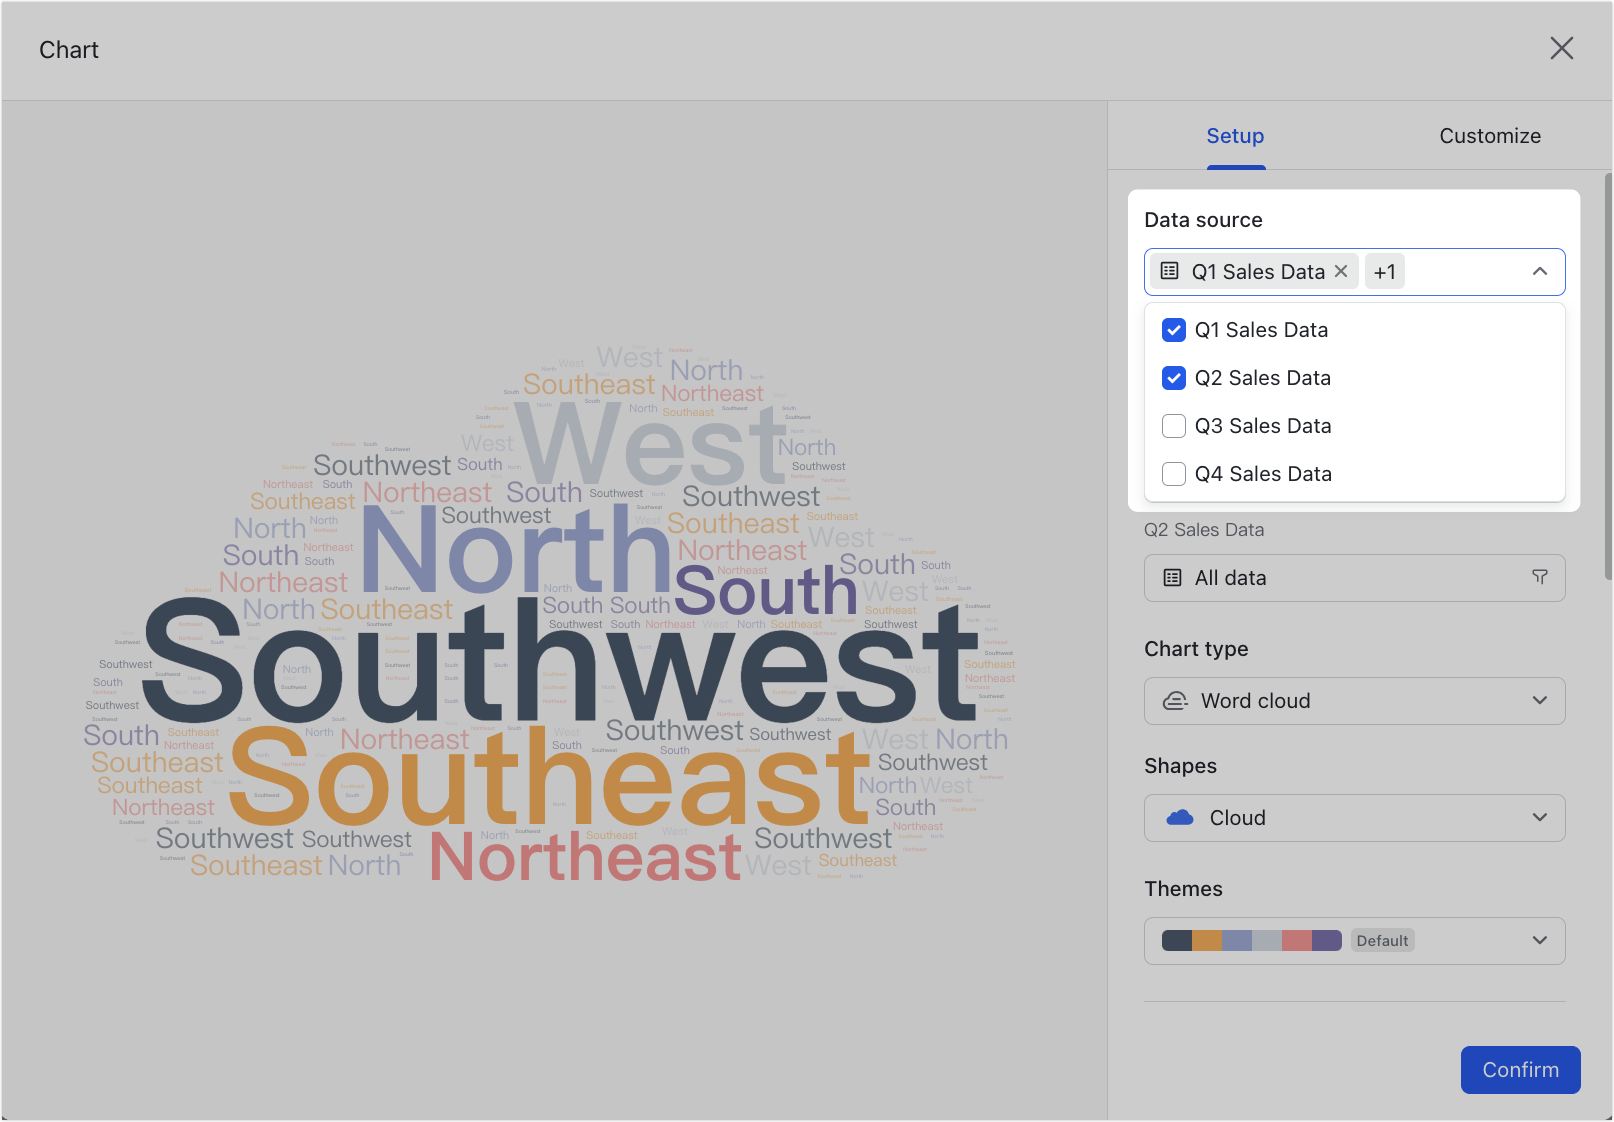
Word clouds
When you select multiple data sources for a word cloud, you can configure the following settings:
- Data range: Select which view to use and set filter conditions for each data source.
- Keyword field: Select the fields for each data source. The fields you select from different data sources must be of the same type. If you change the fields for one data source, the other data sources will automatically switch to the fields of the same type. If a data source has no fields of the same type, no fields will be selected.
- Segmentation options:
- Custom frequency: This can be based on word frequency or a custom number field (number, progress, currency, formula, or lookup).
- Auto segmentation: Keywords are automatically segmented and their frequency is counted.
250px|700px|reset
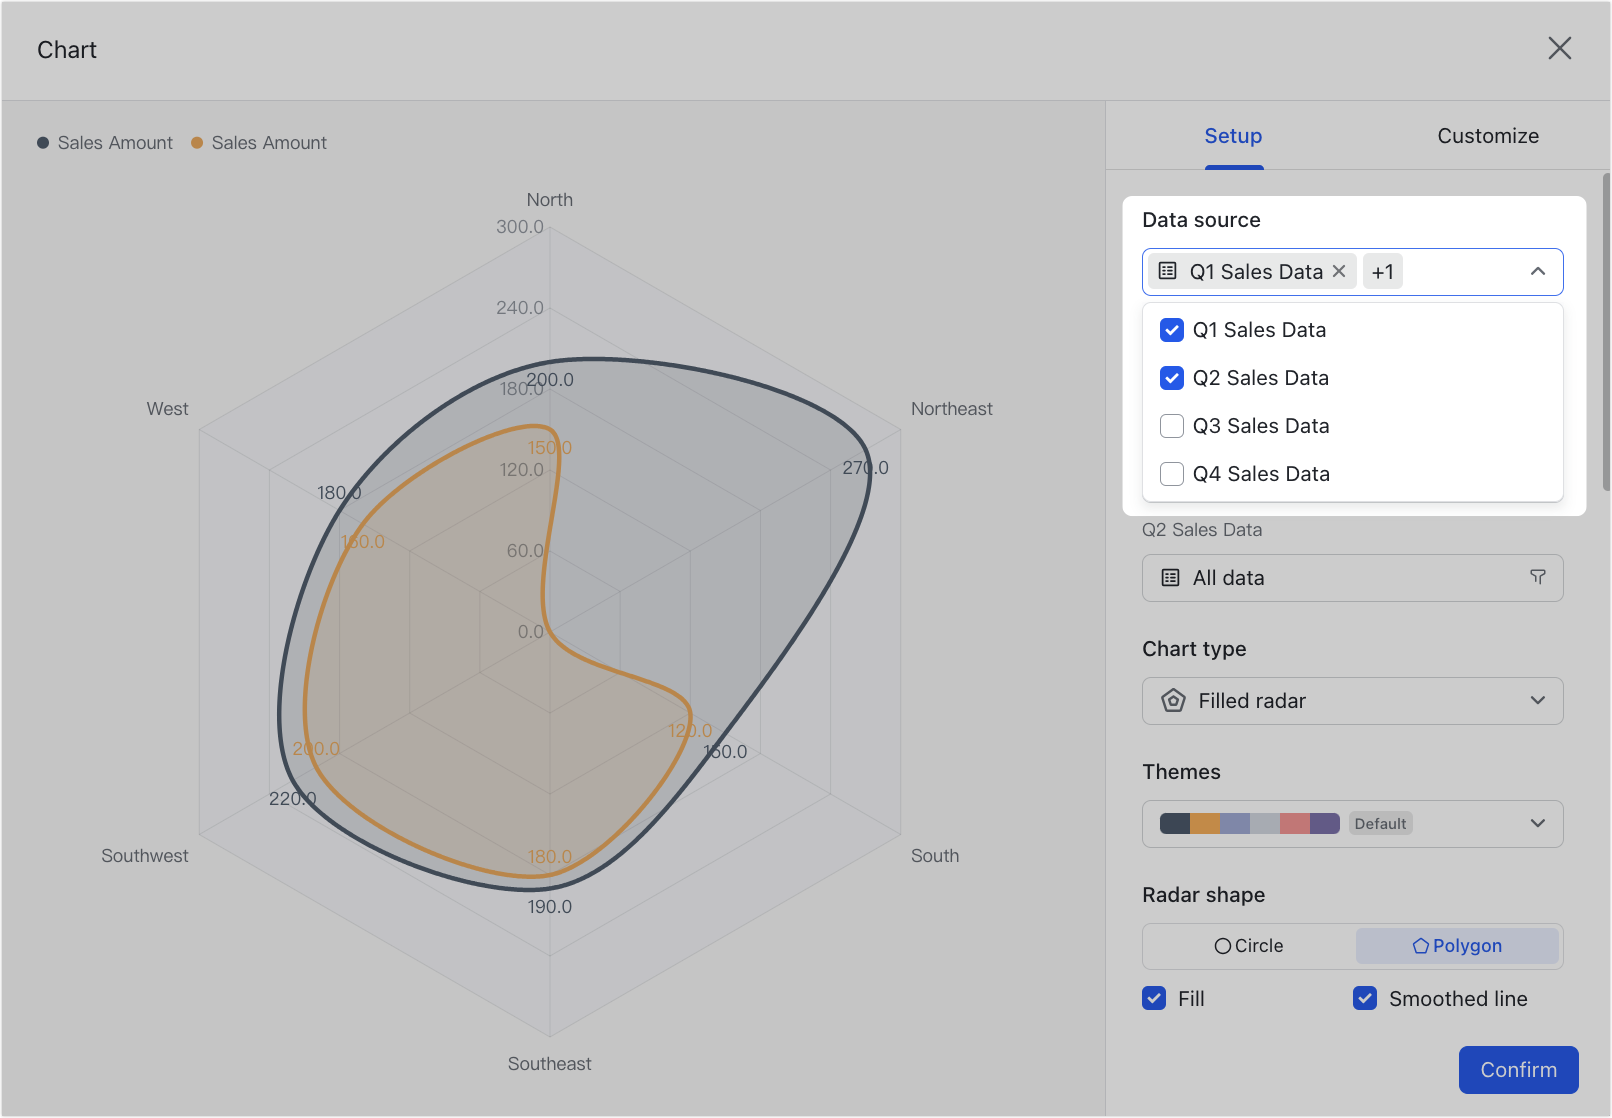
Radar charts
When you select multiple data sources for a radar chart, you can configure the following settings:
- Data range: Select which view to use and set filter conditions for each data source.
- Data categorized by: You can only select Record aggregation as the quantitative indicator.
- Category axis: Select the data fields to display for each data source. The fields you select from different data sources must be of the same type. If you change the fields for one data source, the other data sources will automatically switch to fields of the same type. If a data source has no fields of the same type, no fields will be selected.
- Value axis (series): You can select Number of records (default) or Field summary.
- Number of records: This will calculate the total number of records in the data sources.
- Field summary: This can only be selected if there are number or formula fields in the tables. Only one number field can be selected for each data source. The available calculation methods include Sum, Max, Min, or Average.
- Group by category axis: This option is only available if you have selected multiple data sources. It is selected by default and the data from the different data sources is grouped into a series by the category axis.
250px|700px|reset
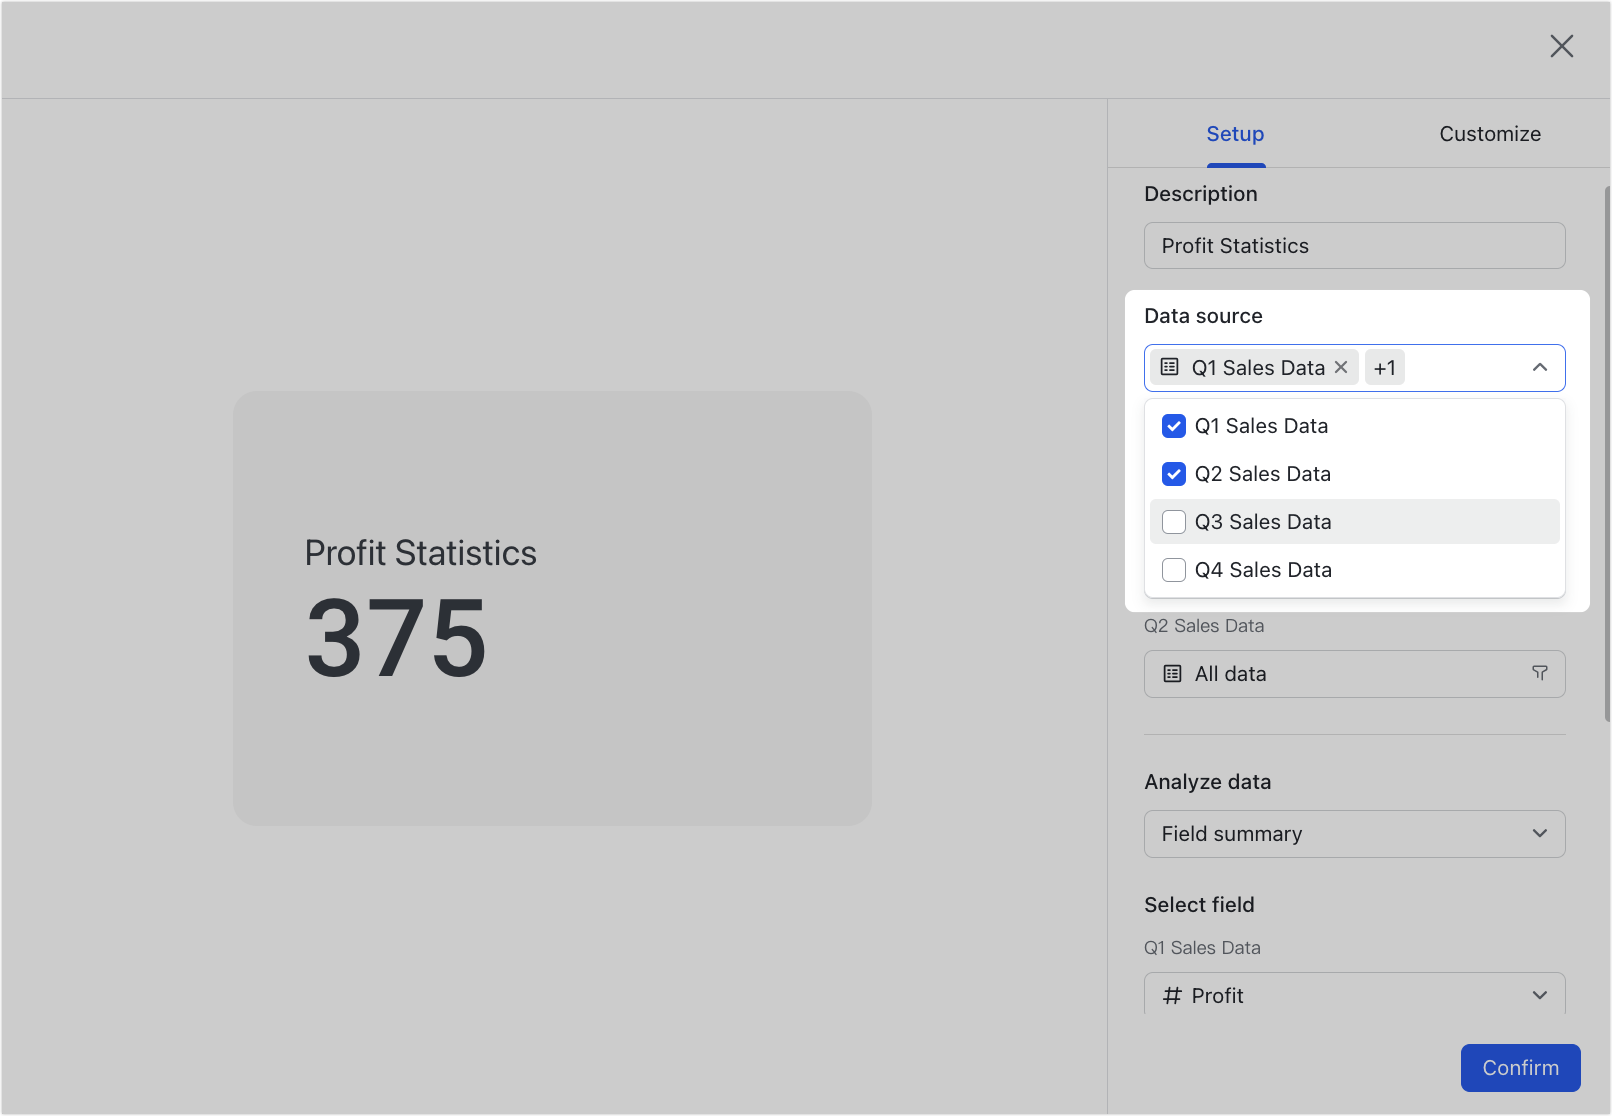
Metrics blocks
When you select multiple data sources for a metrics block, you can configure the following settings:
- Data range: Select which view to use and set filter conditions for each data source.
- Analyze data: You can select Number of records (default) or Field summary as the analytical method.
- Number of records: This will calculate the total number of records in the data sources.
- Field summary: This can only be selected if there are number or formula fields in the tables. Only one number field can be selected for each data source. The available calculation methods include Sum, Max, Min, or Average.
Note: If you select multiple data sources, you cannot select Change over time and Trend chart.
250px|700px|reset
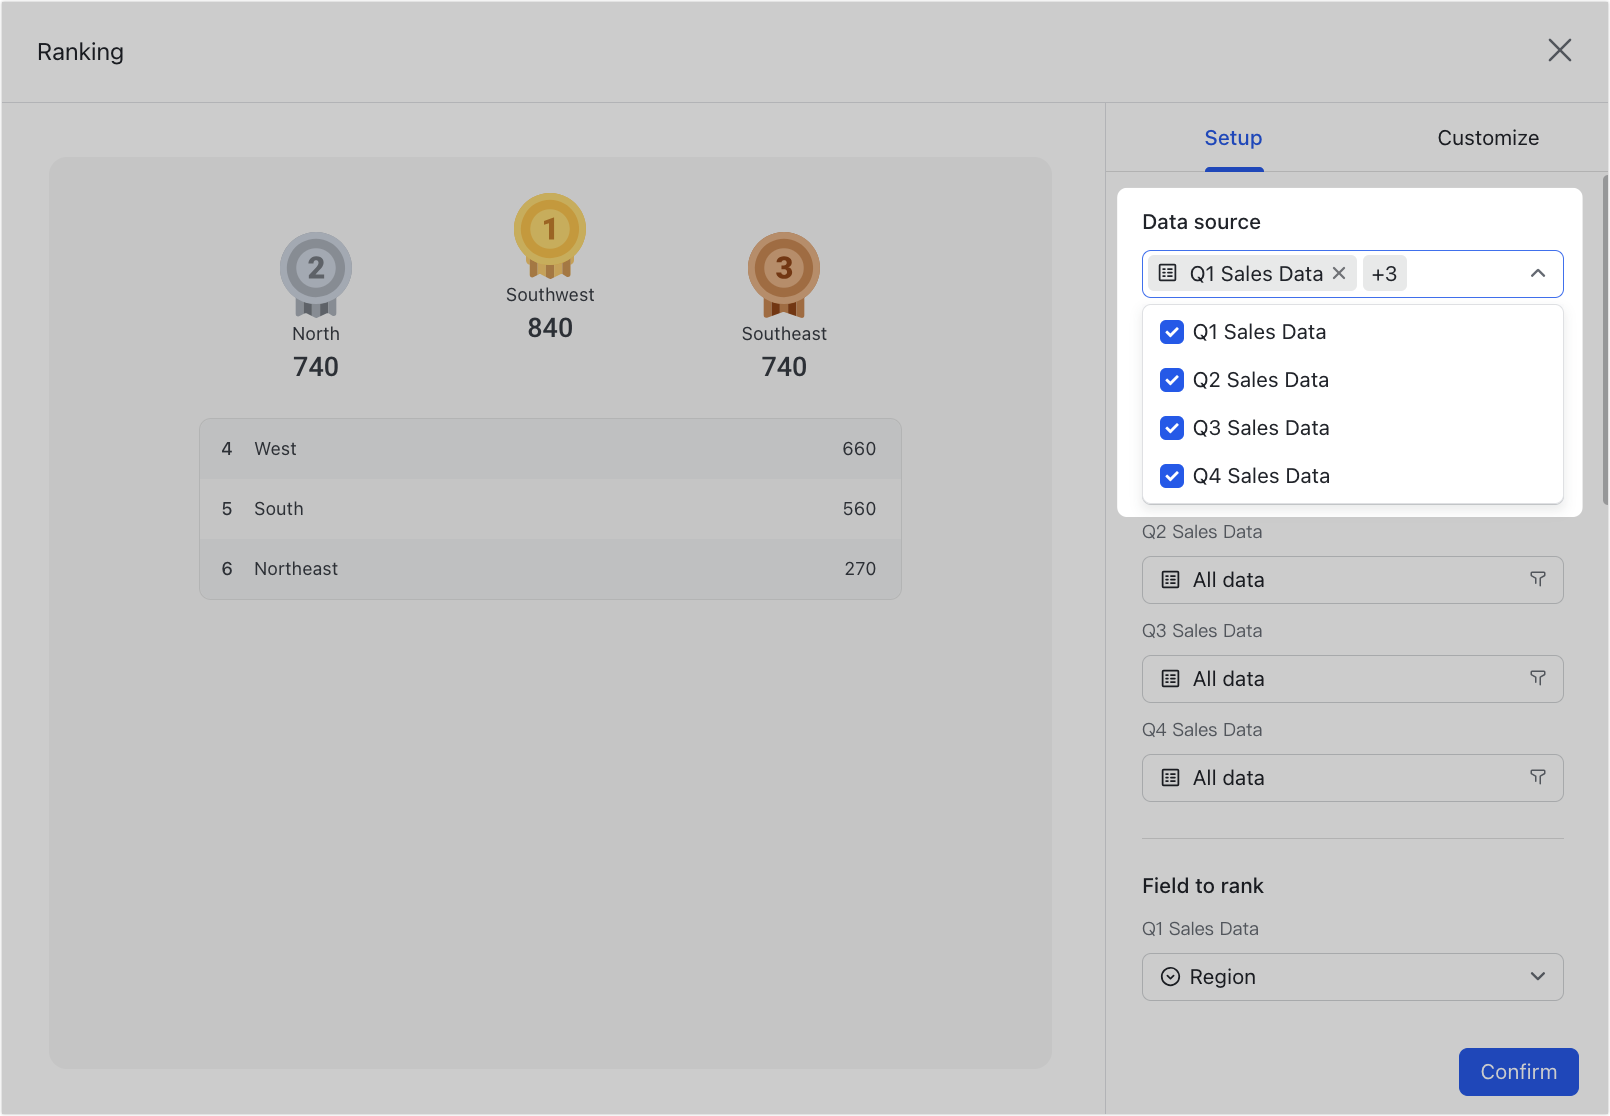
Ranking blocks
When you select multiple data sources, you can configure the following settings:
- Data range: Select which view to use and set filter conditions for each data source.
- Field to rank: Select the data field to be displayed. The fields you select from different data sources must be of the same type. If you change the fields for one data source, the other data sources will automatically switch to fields of the same type. If a data source has no fields of the same type, no fields will be selected.
- Calculate ranking by: You can select Number of records (default) or Field summary as the basis for calculating rankings.
- Number of records: This will calculate the total number of records in the data sources.
- Field summary: This can only be selected if there are number or formula fields in the tables. Only one number field can be selected for each data source. The available calculation methods include Sum, Max, Min, or Average.
250px|700px|reset