
Available with these plans:
Starter
Basic
Pro
Enterprise
To upgrade your Lark Plan or for more information, contact Support or your Customer Success Manager. The Lark Basic plan supports only specific countries and regions.
I. Intro
In Base dashboards, different data can be displayed for different users. For example, visitors will only be able to view data in the dashboard based on the permissions they're granted from advanced permissions. This allows team members to see the most relevant data while ensuring more sensitive data remain protected.
Use cases:
- Track sales performance: You can create a dashboard for the sales team, where the sales manager can view the entire team's performance figures, while each salesperson can only view their own sales data, giving them a better understanding of their work performance and completion of objectives.
- Monitor project progress: You can create a dashboard for project management, where project managers can monitor the progress, allocation of resources, and key milestones for all projects, while members of different projects can only view the tasks and progress for their own project, allowing them to focus on their own work and update progress as needed.
- Analyze human resources: You can create a dashboard for the HR team, where the HR manager can view data on all members, such as performance evaluations, training records, and so on, while each department supervisor can only view information related to the members of their own department, facilitating targeted personnel management and decision-making.
Note: This feature can be enabled by base administrators.
II. Steps
- Enable the feature as an administrator
Prerequisites: Administrators need to upgrade the base to the new version of dashboard and turn on advanced permissions before they can enable Analyze data based on visitors' permissions.
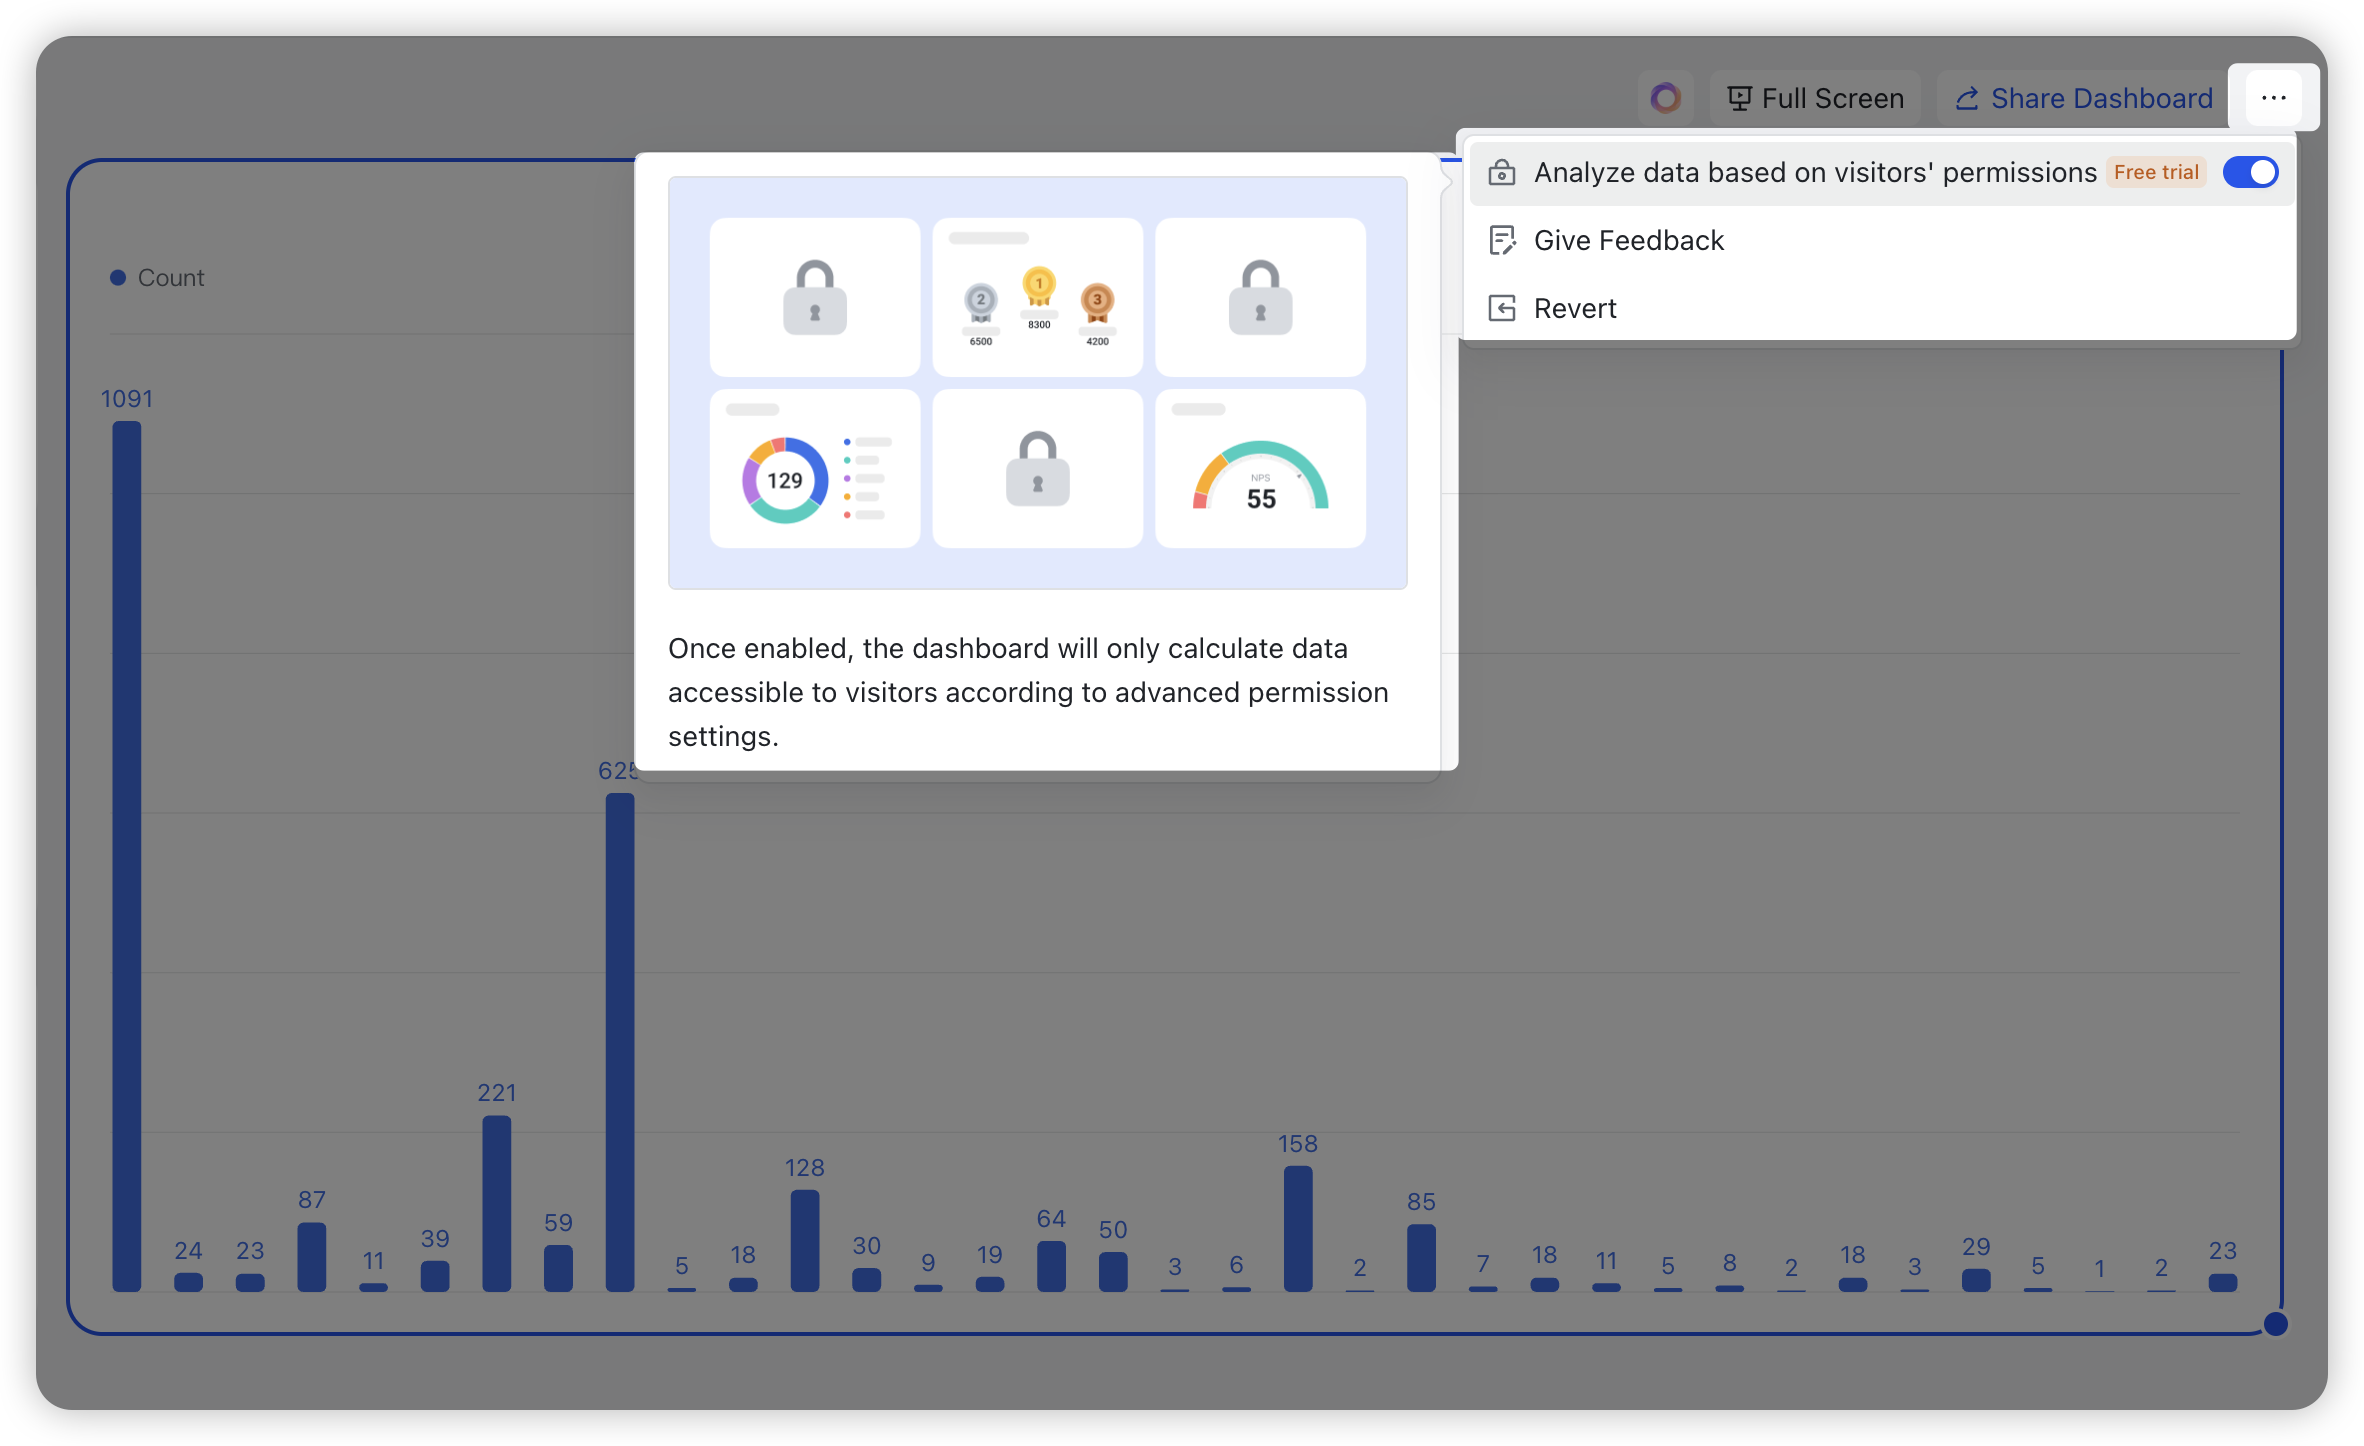
To enable the feature, open the base dashboard, click the ··· icon in the upper-right corner, and turn on Analyze data based on visitors' permissions.
250px|700px|reset
Once this feature is enabled, data in dashboard blocks and extensions, Base blocks in Workplace, preview pages of advanced permissions, and other pages will be analyzed based on advanced permissions settings.
Note: Administrators cannot analyze data based on visitors' permissions when sending dashboards through automation or share dashboards. All data will be displayed on these pages.
- View dashboard data as a visitor
Once the administrator for a base has enabled Analyze data based on visitors' permissions, visitors will only be able to view dashboard data that corresponds to their permissions.
The following sections describe what is displayed in the dashboard to visitors with different permissions and what administrators can configure and see.
Scenario 1: Records not visible to visitors
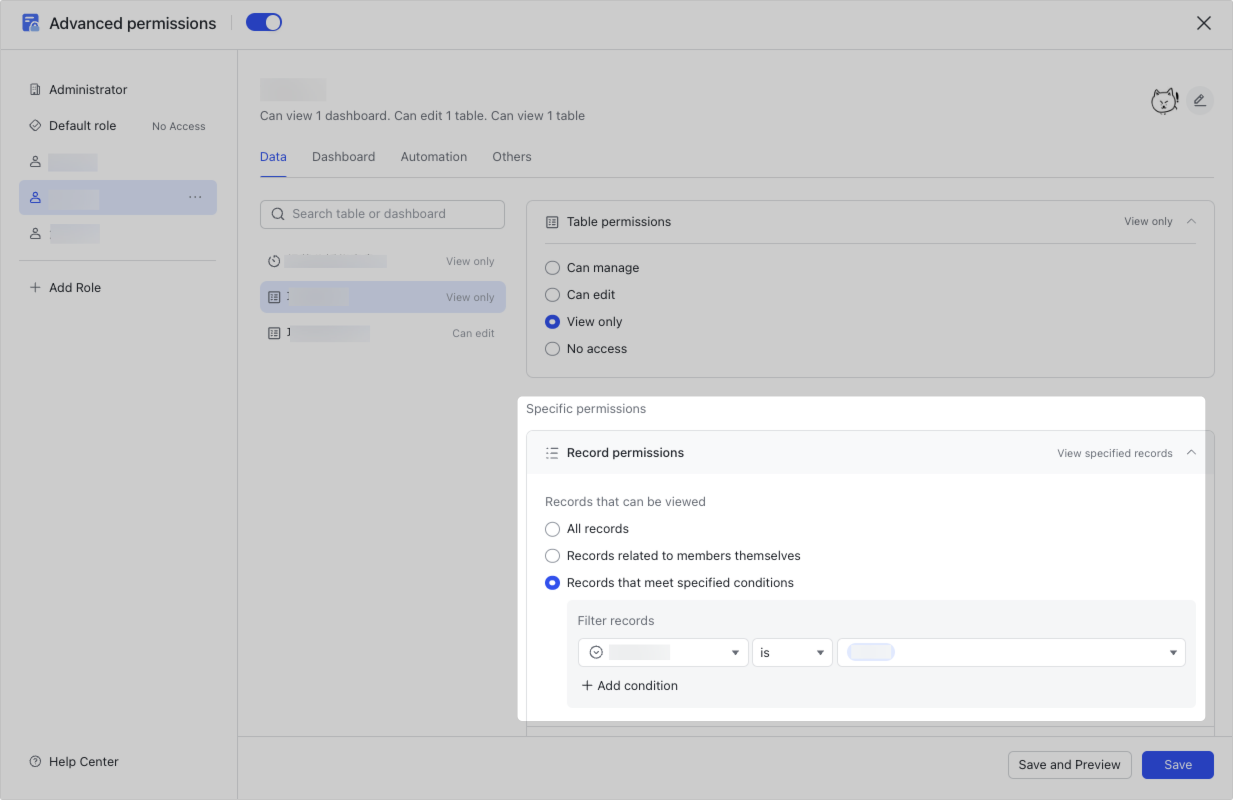
- Advanced permission settings: Role A has view or edit permissions for records whose "Region" is "East Coast", but does not have view permission for other records.
250px|700px|reset
- Dashboard as seen by a visitor who only has Role A permissions:
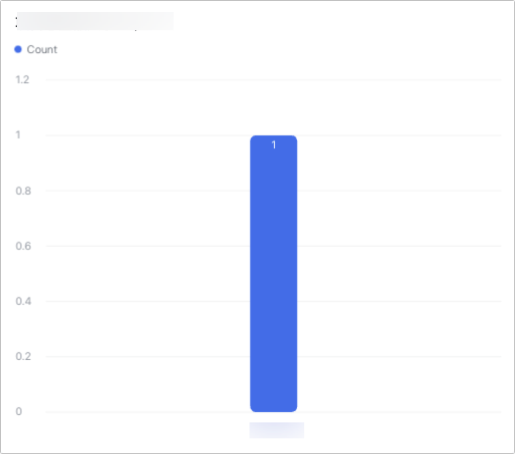
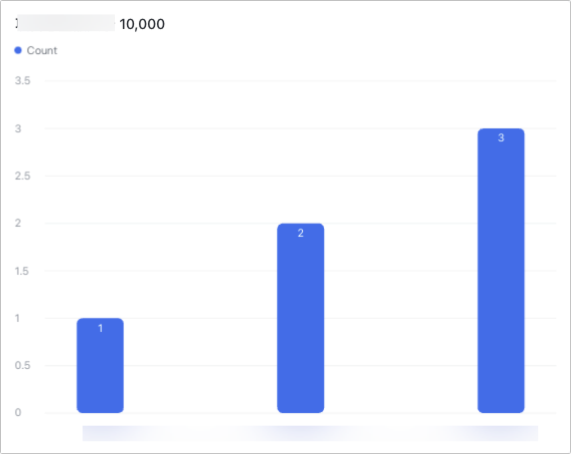
- A visitor who only has Role A permissions will only be able to view base records whose "Region" is "East Coast", which means only the data where the "Region" is "East Coast" will appear in their dashboard.
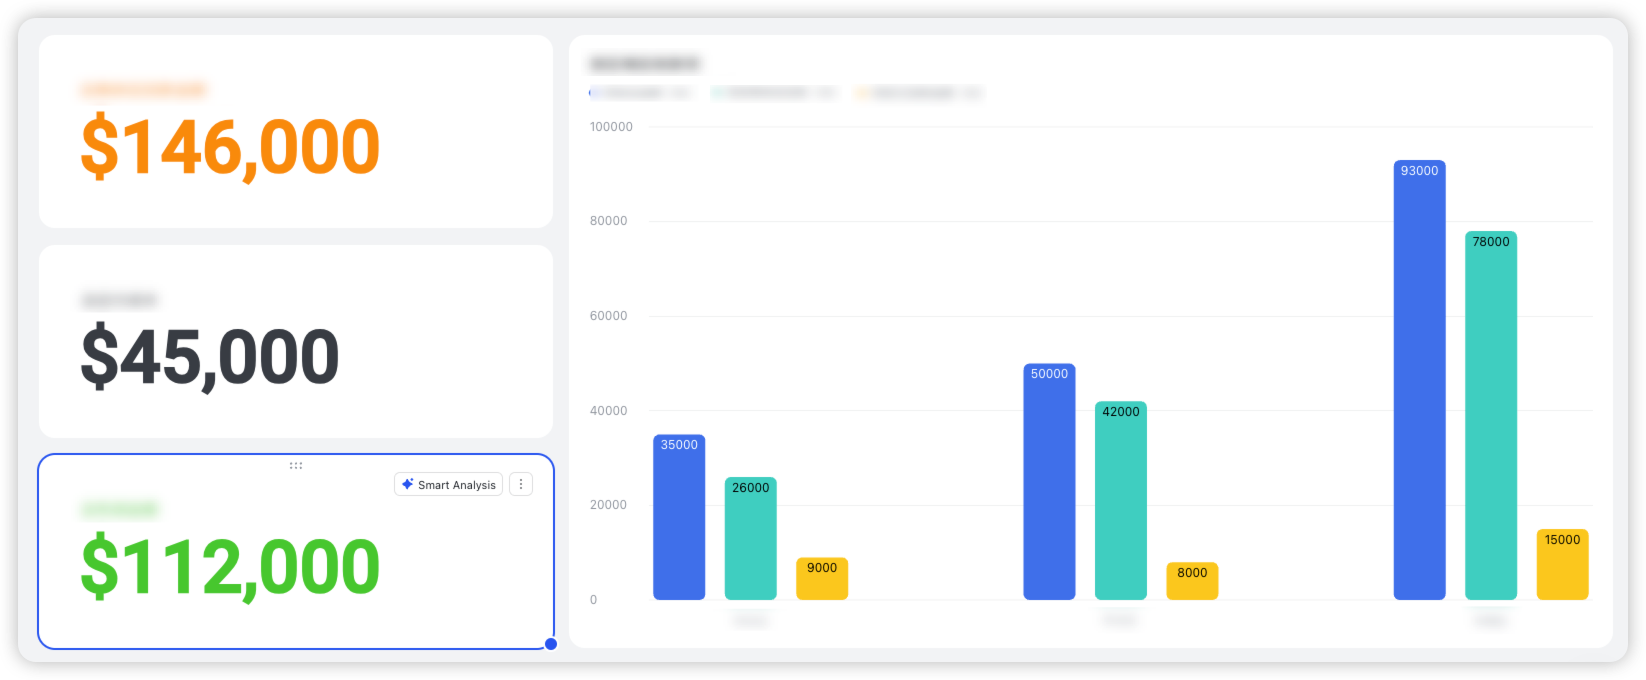
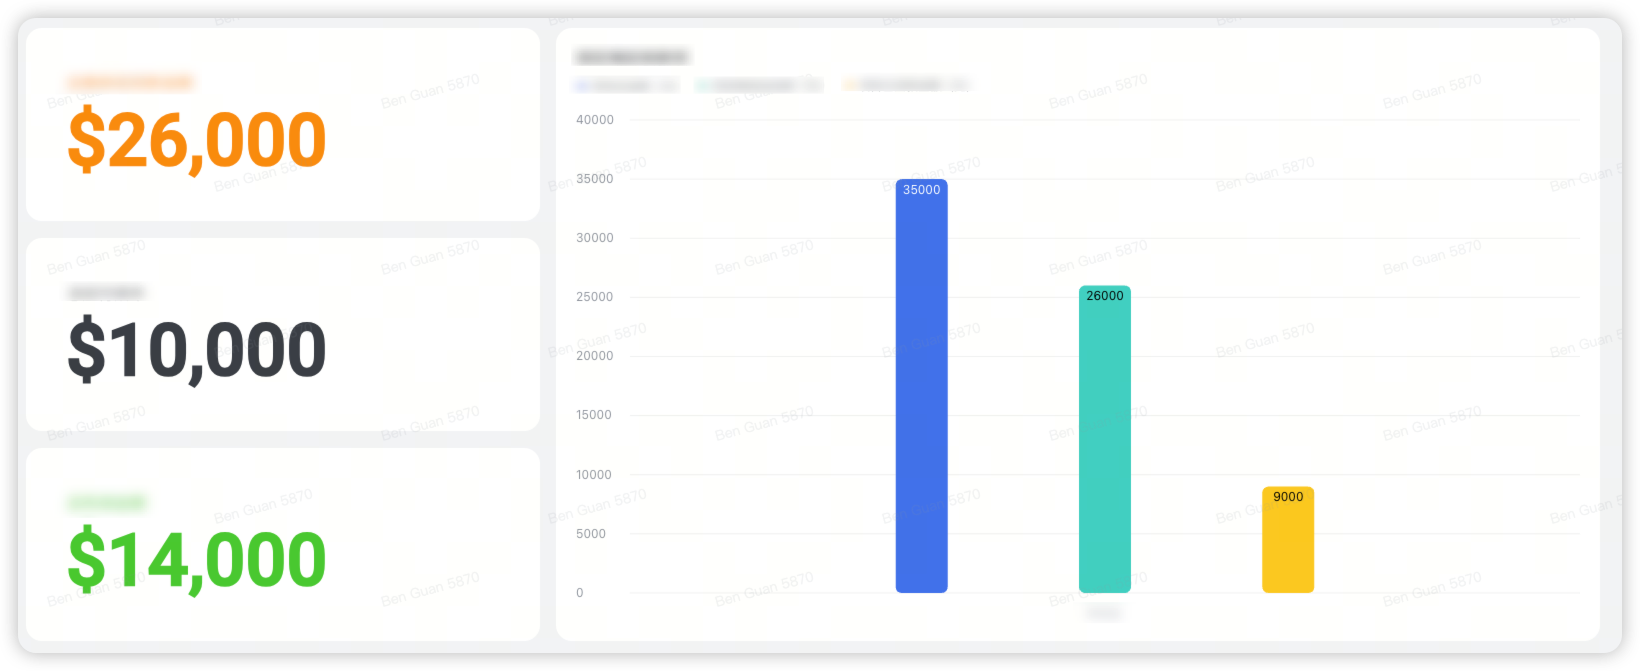
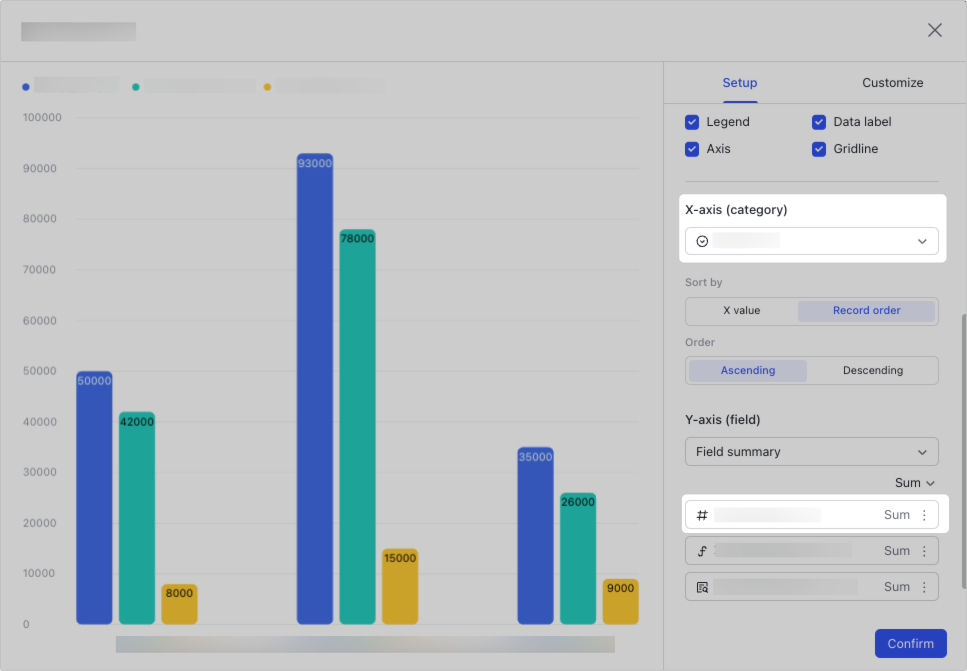
- For example, if an administrator adds a dashboard to display the sales figures for all regions, Role A will only be able to view the sales figures for the East Coast.
- The image on the left shows what the administrator will see, and the image on the right shows what Role A will see.
250px|700px|reset
250px|700px|reset
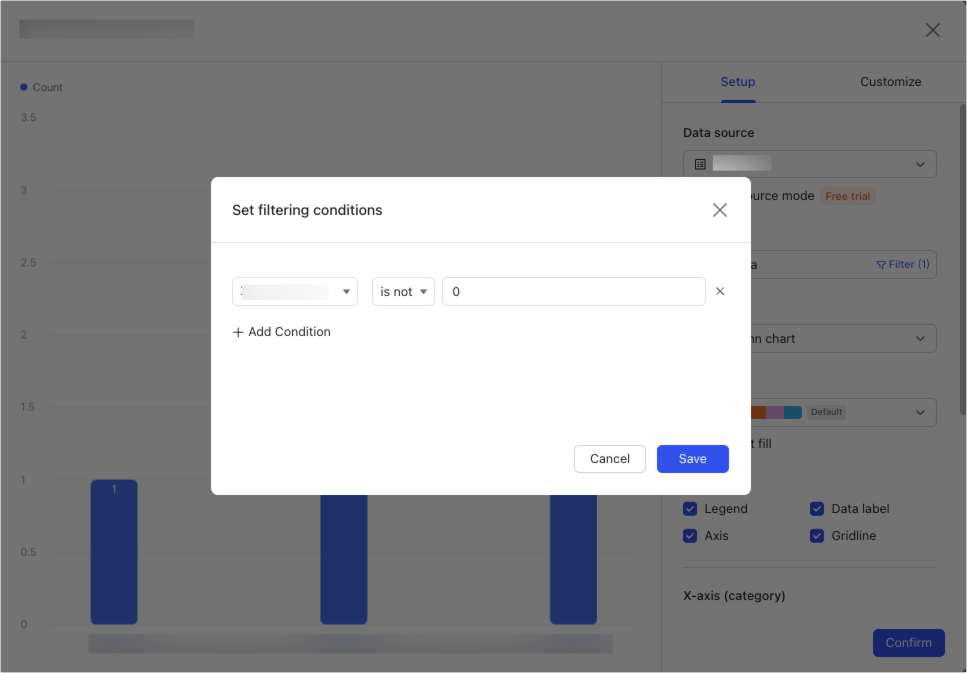
If the administrator applies a filter to display the number of projects in all regions where the "Project's payable balance (USD)" is not 0, then the visitor will only be able to view the number of projects in the East Coast where the "Project's payable balance (USD)" is not 0.
250px|700px|reset
250px|700px|reset
Note: When configuring Dashboard blocks, if records that are not visible to a visitor are set as the key data source of a block, the visitor will only be able to view data for which they have permissions, as shown in the table below:
Block type | What the administrator will see | What the visitor will see (when they can only view records from "East Coast region") |
Column chart, line chart, bar chart, area chart, scatter chart, and combo chart (bar chart used as an example) | 250px|700px|reset | 250px|700px|reset |
250px|700px|reset | 250px|700px|reset | |
Pie chart | 250px|700px|reset | 250px|700px|reset |
250px|700px|reset | 250px|700px|reset | |
Word cloud | 250px|700px|reset | 250px|700px|reset |
250px|700px|reset | 250px|700px|reset | |
250px|700px|reset | 250px|700px|reset | |
250px|700px|reset | 250px|700px|reset | |
250px|700px|reset | 250px|700px|reset | |
Unaffected | | |
Scenario 2: Fields not visible to visitors
- Advanced permission settings: Role B has view permission for all fields except "Total project amount (USD)".
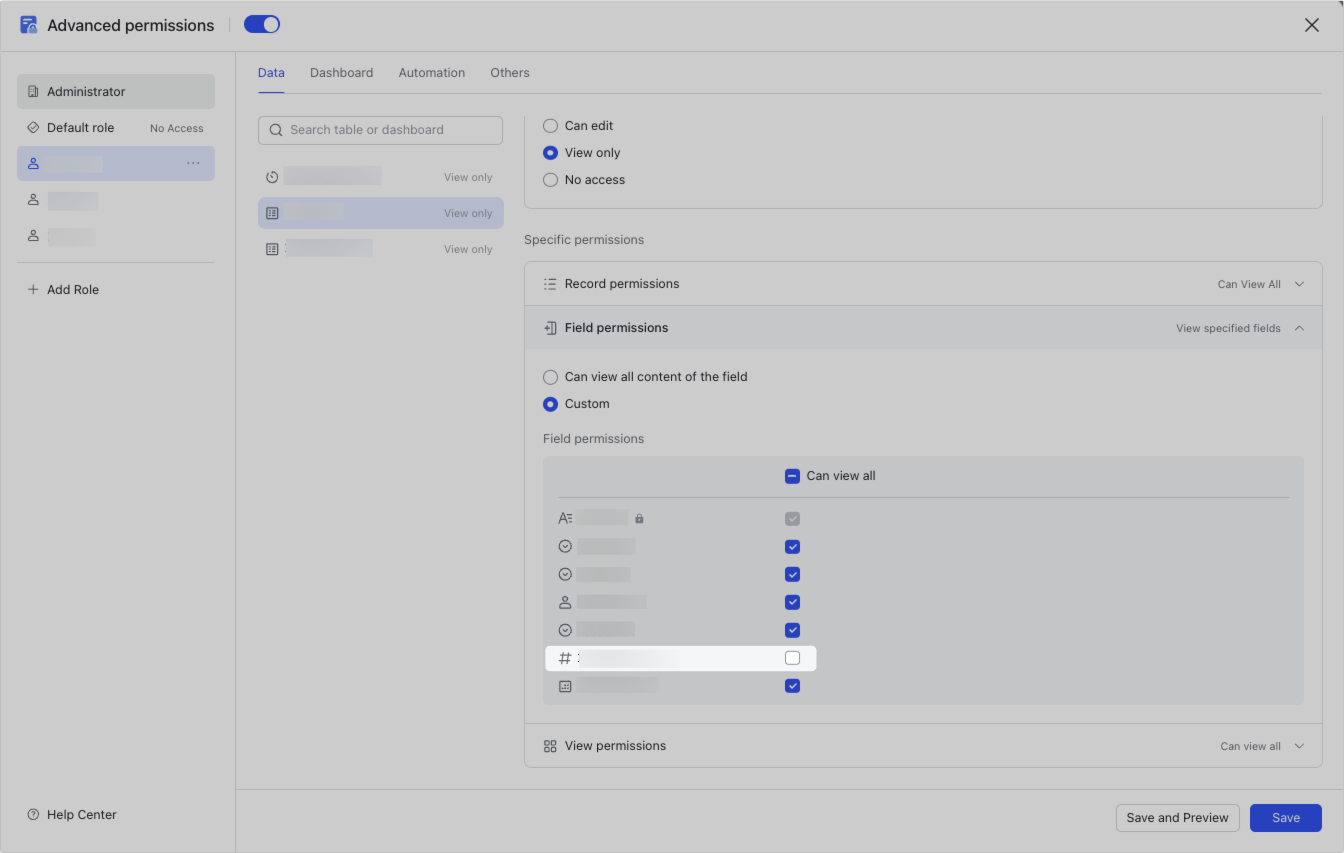
250px|700px|reset
- Dashboard as seen by a visitor who only has Role B permissions:
- A visitor who only has Role B permissions will be unable to view data in the base field "Total project amount (USD)", so they won't be able to view any dashboard blocks related to the "Total project amount (USD)" field.
- For example, if the administrator adds a column chart showing "Total project amount (USD)" for different regions, the visitor won't be able to view the column chart.
250px|700px|reset
250px|700px|reset
If the administrator only uses the "Total project amount (USD)" field as a filtering condition in the column chart, then the column chart as seen by the visitor will be the same as what the administrator sees.

250px|700px|reset
250px|700px|reset
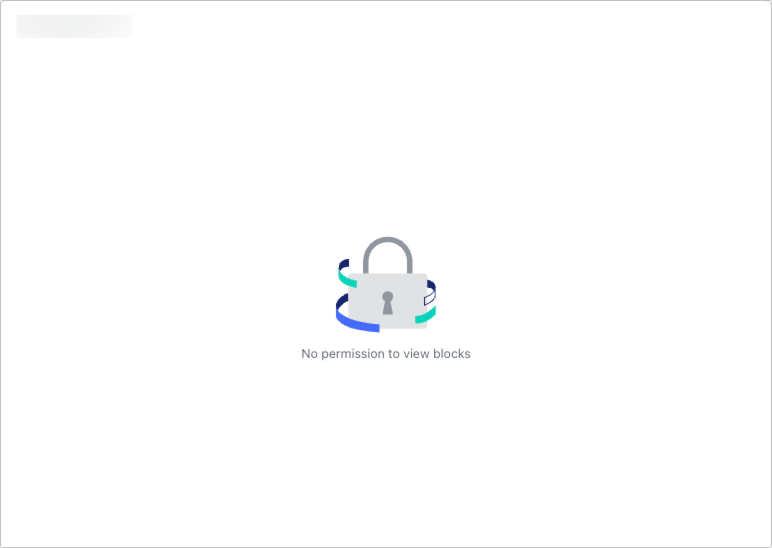
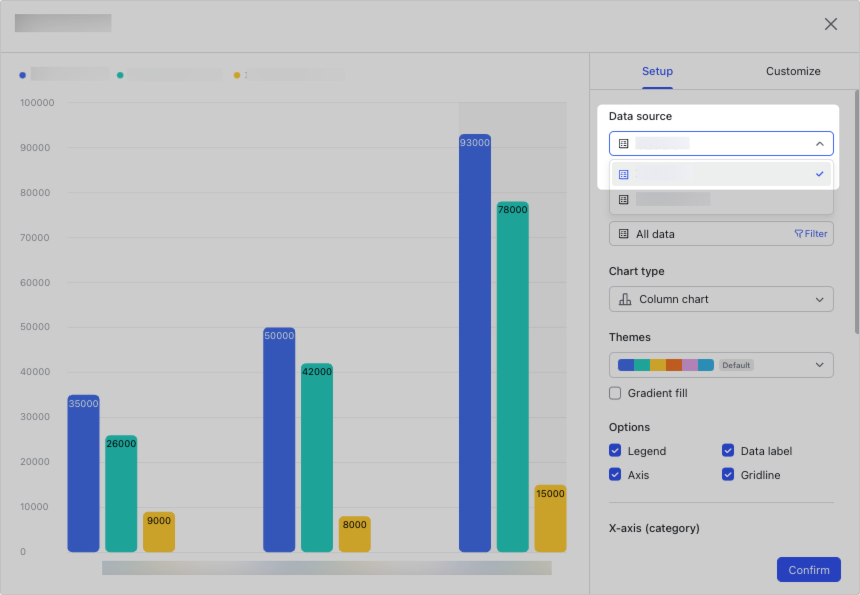
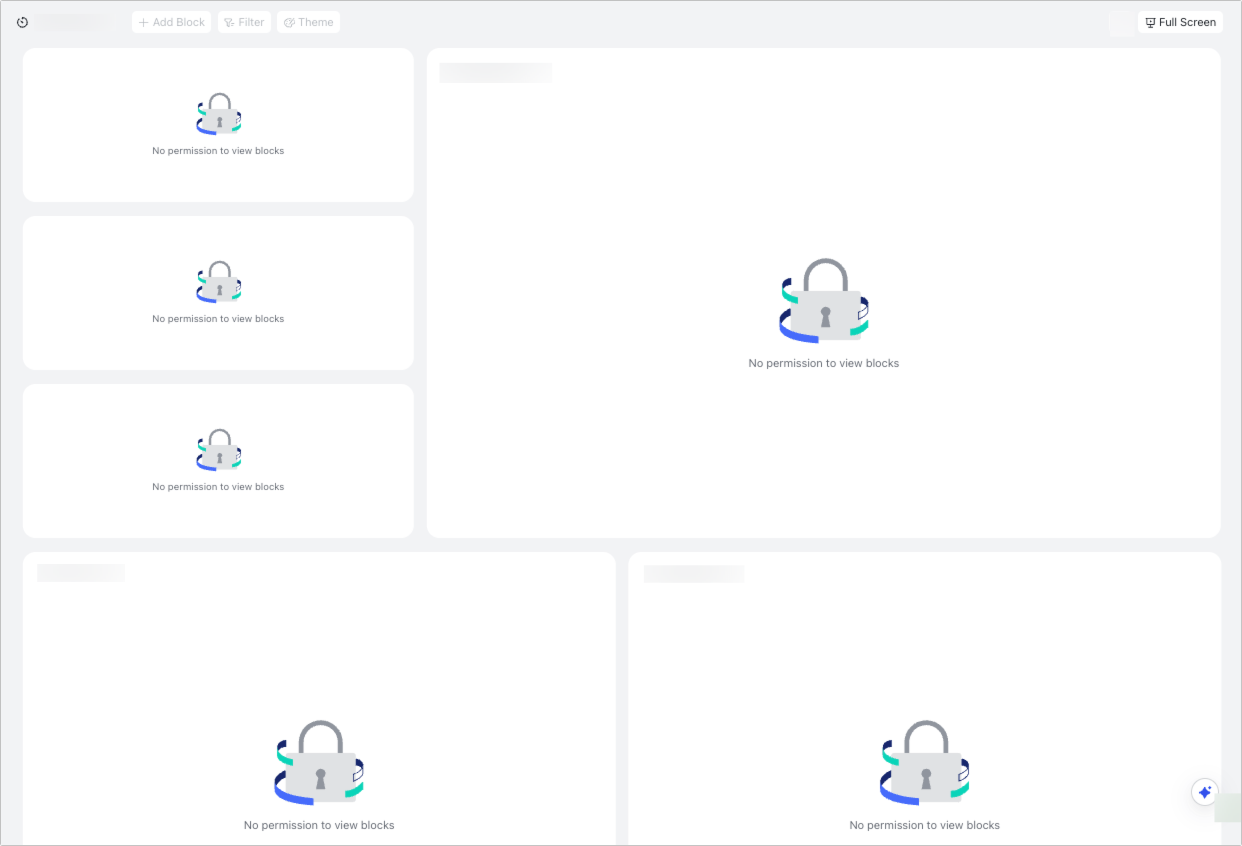
Note: When configuring dashboard blocks, if fields that are not visible to a visitor (referred to as unviewable fields) are set as the key data source of a block, the visitor will get the prompt "No permission to view blocks". For more information on configuring blocks to prevent certain visitors from viewing them, see the table below:
Block type | Configurations that will make the block not viewable to visitors (only one condition needs to be met) | Configuration screenshot | What the visitor will see |
Column chart, line chart, bar chart, area chart, scatter chart, and combo chart |
| 250px|700px|reset | 250px|700px|reset |
| 250px|700px|reset | | |
Pie chart |
| 250px|700px|reset | |
| 250px|700px|reset | | |
Word cloud |
| 250px|700px|reset | |
| 250px|700px|reset | | |
| 250px|700px|reset | | |
| 250px|700px|reset | | |
Unaffected | | | |
Scenario 3: Tables invisible to visitors
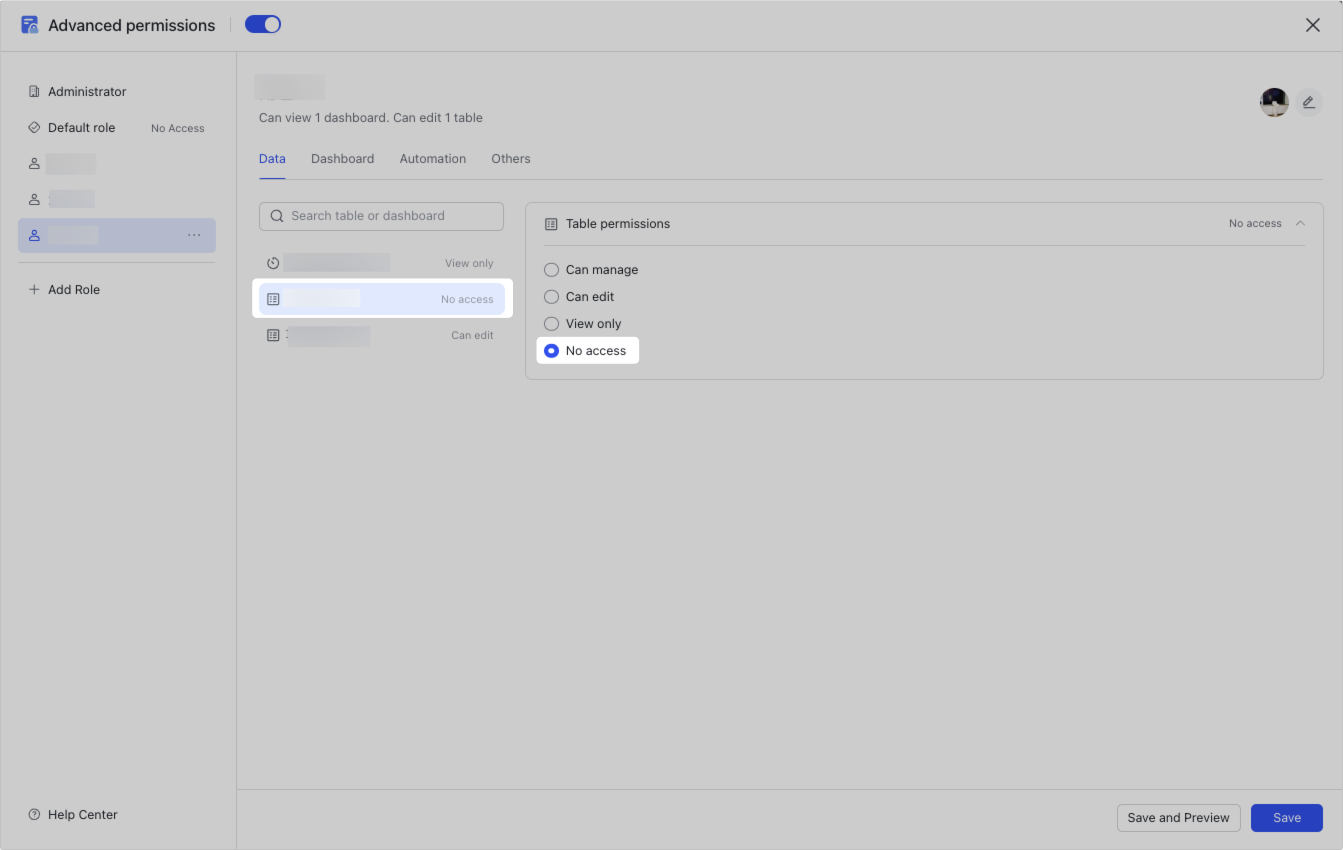
- Advanced permission settings: Role C does not have view permission for the table "Project summary".
250px|700px|reset
- Dashboard as seen by a visitor who only has Role C permissions:
- A visitor who only has Role C permissions won't be able to view any data in the "Project summary" table, so they won't be able to view any dashboard blocks in which the data source is the "Project summary" table.
250px|700px|reset
250px|700px|reset