

00:00
/
00:00
Audio/video is not supported
Please TryRefresh
Play
Fullscreen
Click and hold to drag
I. Intro
Sheets is a powerful tool for data processing, analysis, and visualization, helping you make sense of your data. What's more, Sheets is cloud-based, which means you can work together on the spreadsheet with your whole team at the same time and take it anywhere you go. Sheets is also seamlessly integrated with the larger Lark ecosystem, so content can be easily shared through Messenger and charts and data can be referenced in Docs.
II. Get to know the Sheets interface
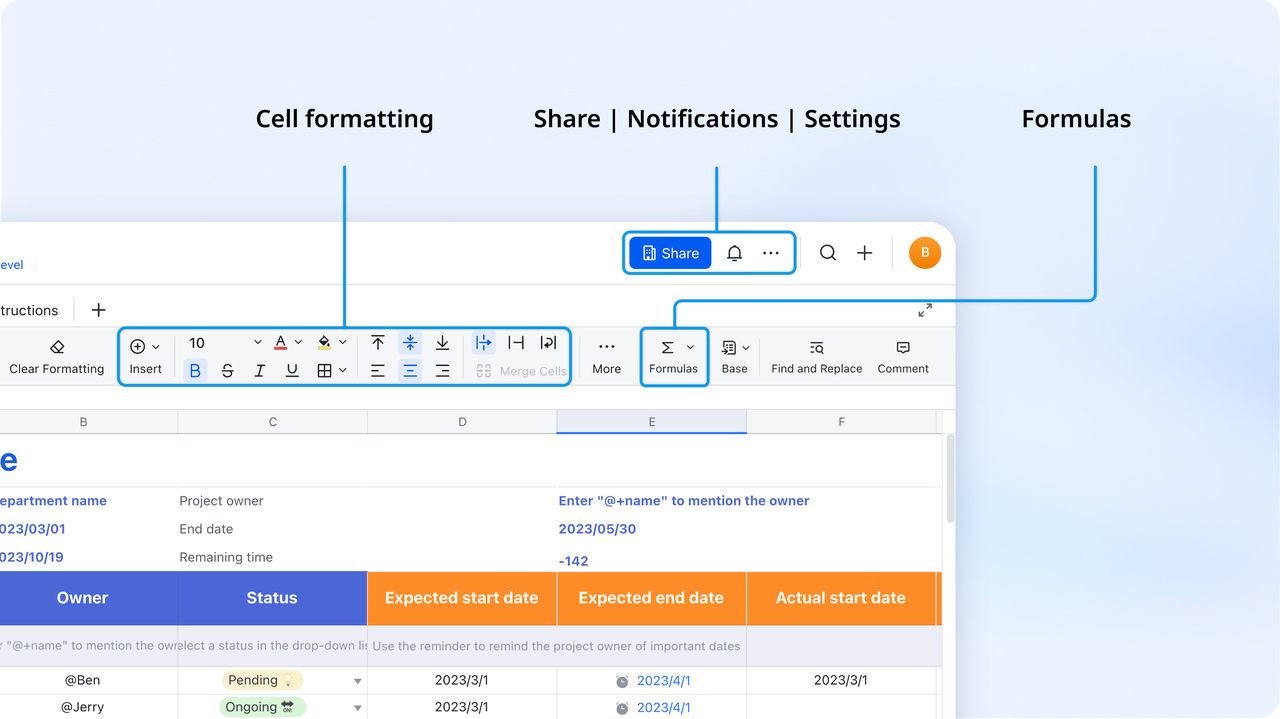
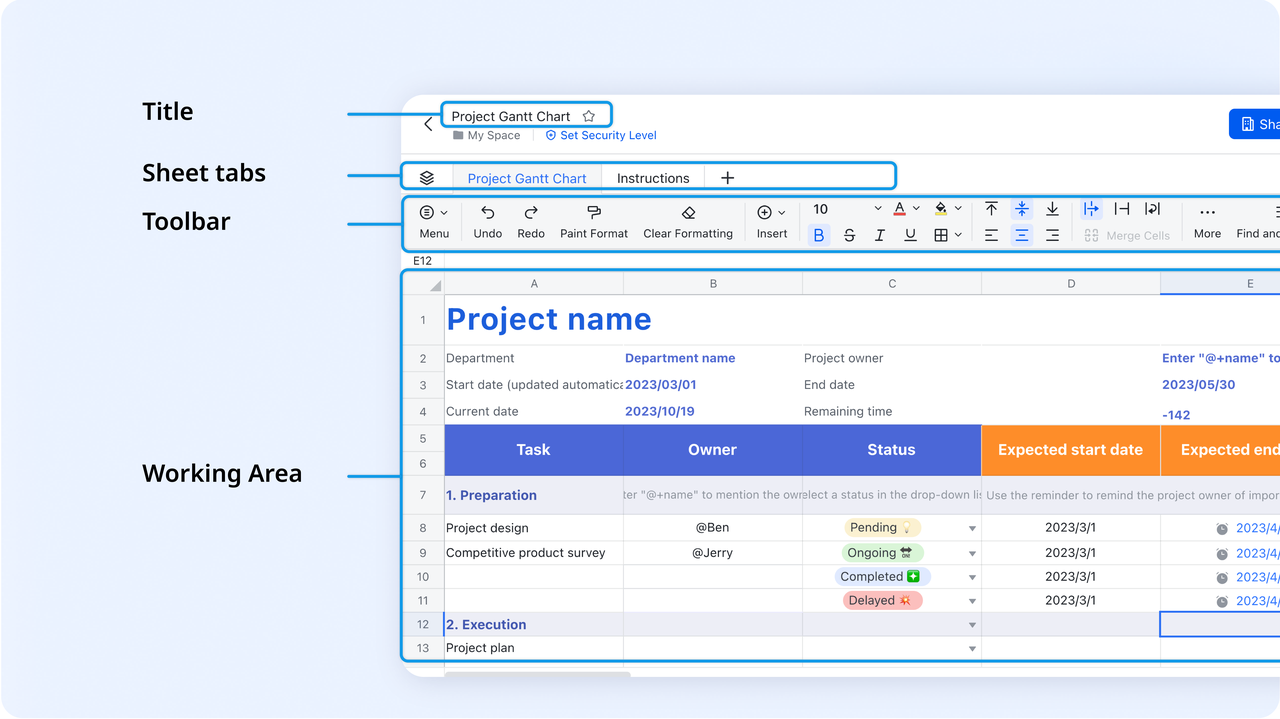
250px|700px|reset
250px|700px|reset
III. Steps to make the most of Sheets
Step 1: Create a spreadsheet
You can create a new spreadsheet or convert a local spreadsheet into a Lark document.
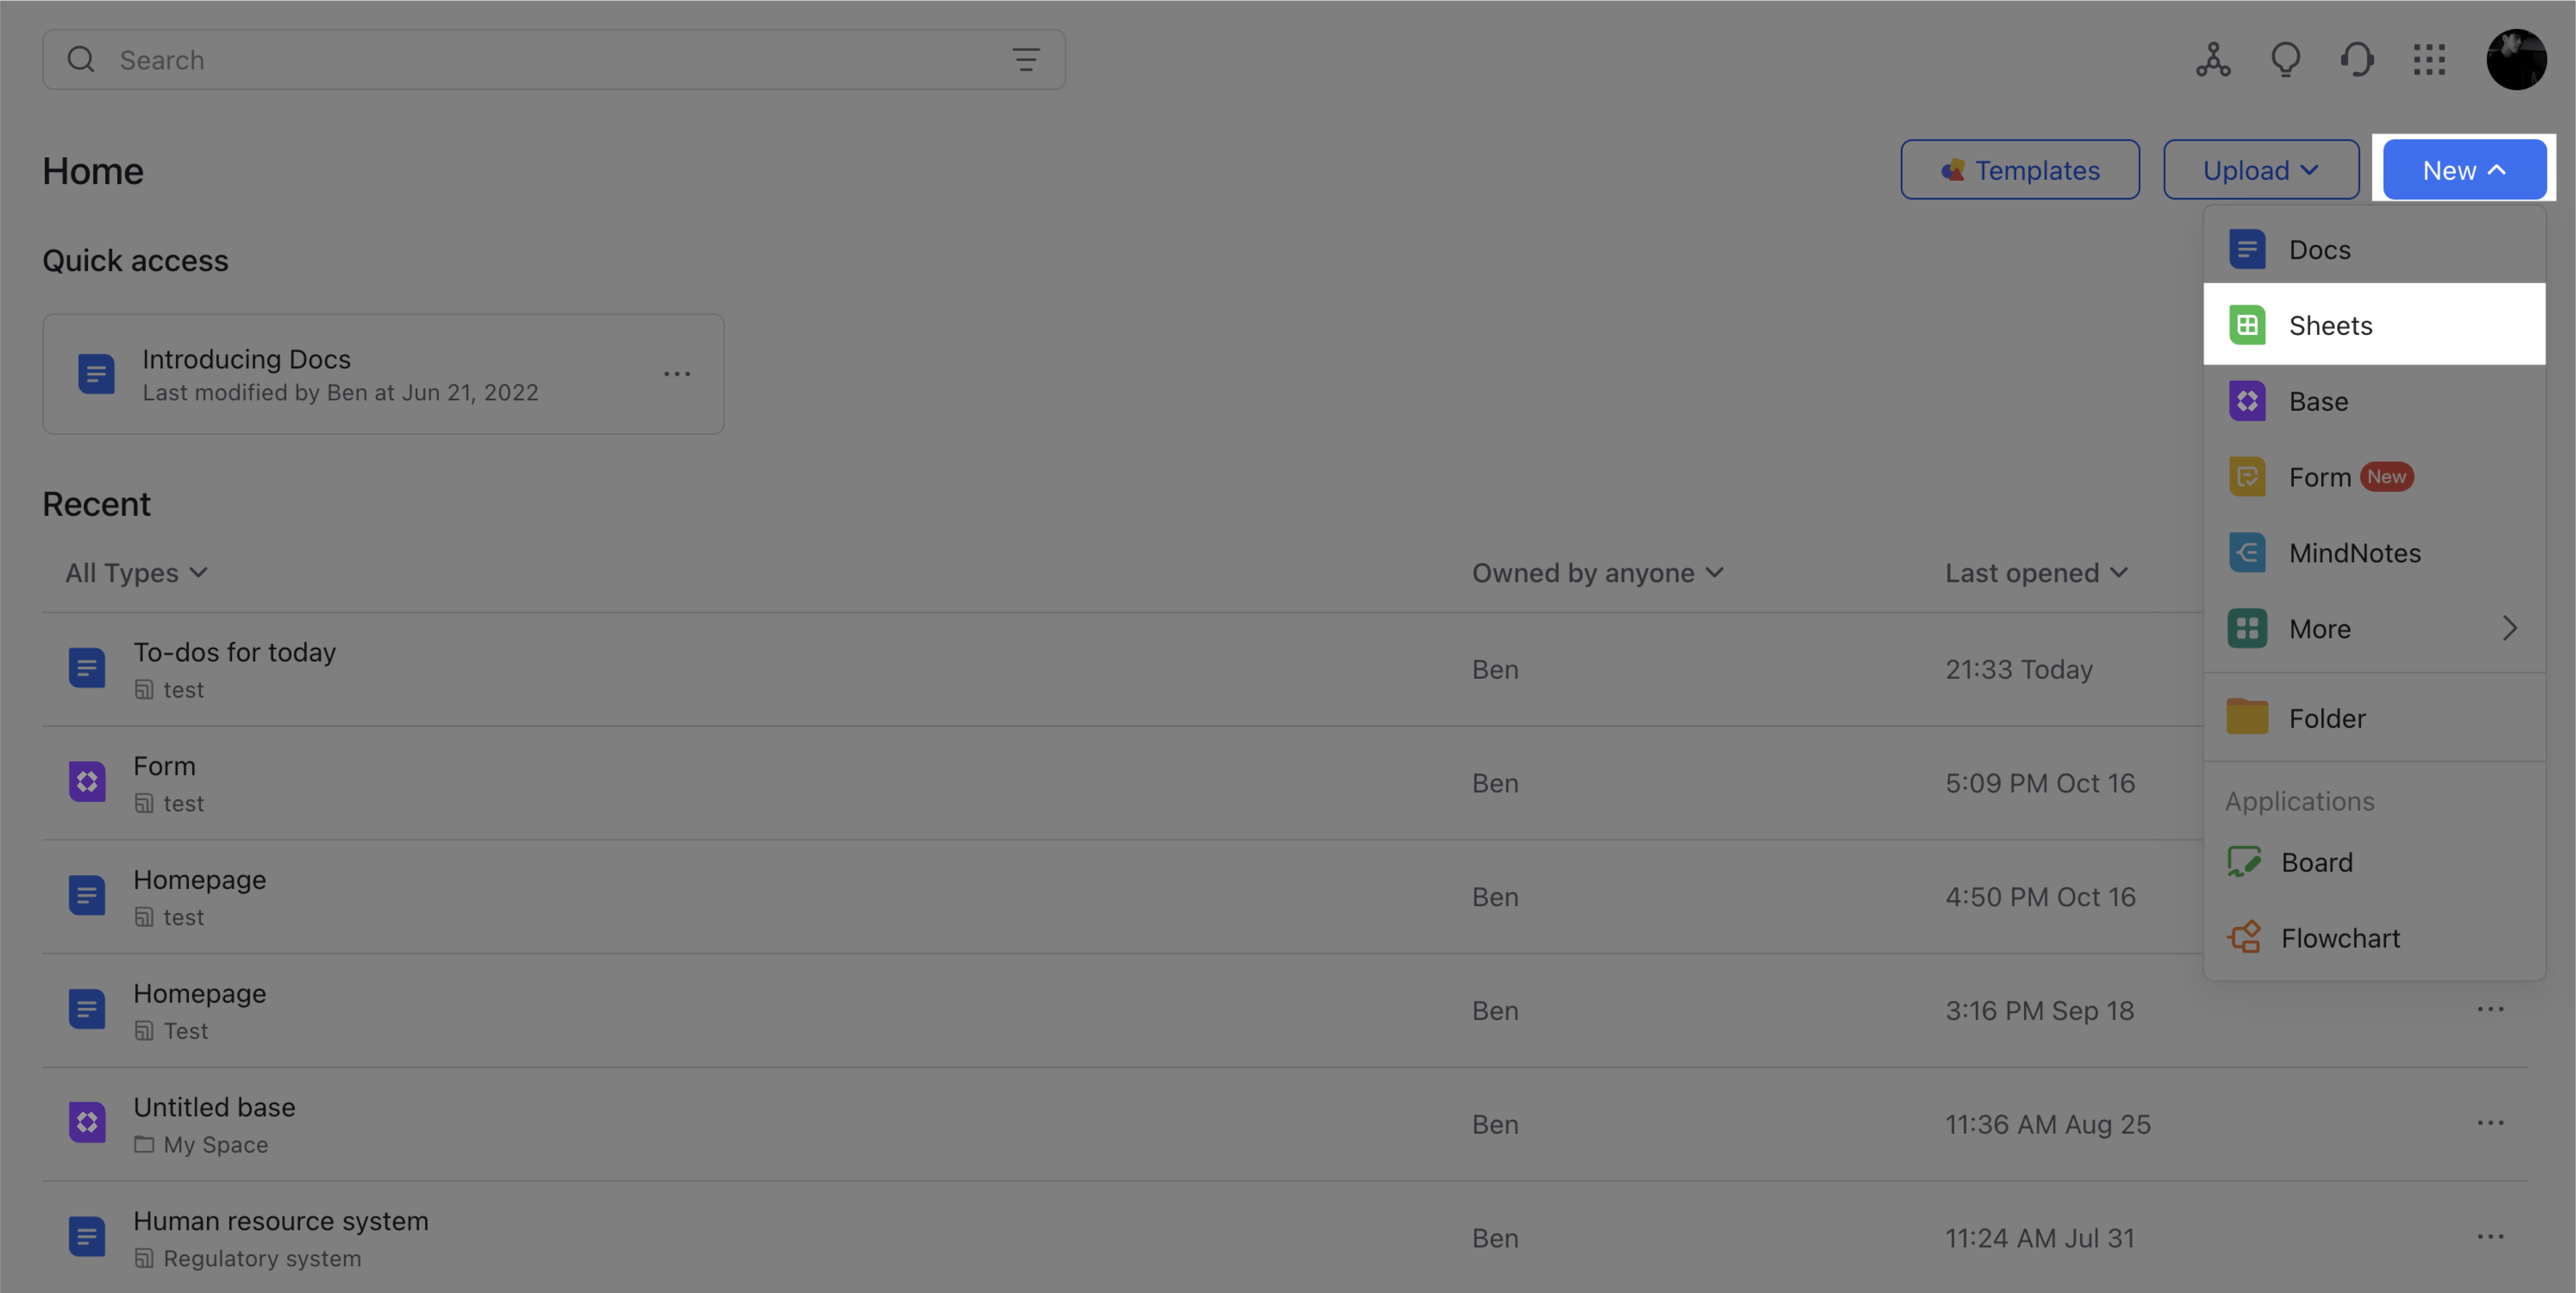
Create a new spreadsheet
On the Lark Docs homepage, click New > Sheets, and select blank or a template.
- There are hundreds of templates tailored for a wide range of business needs, from project management to work reports. Head over to the template gallery to take a look.
250px|700px|reset
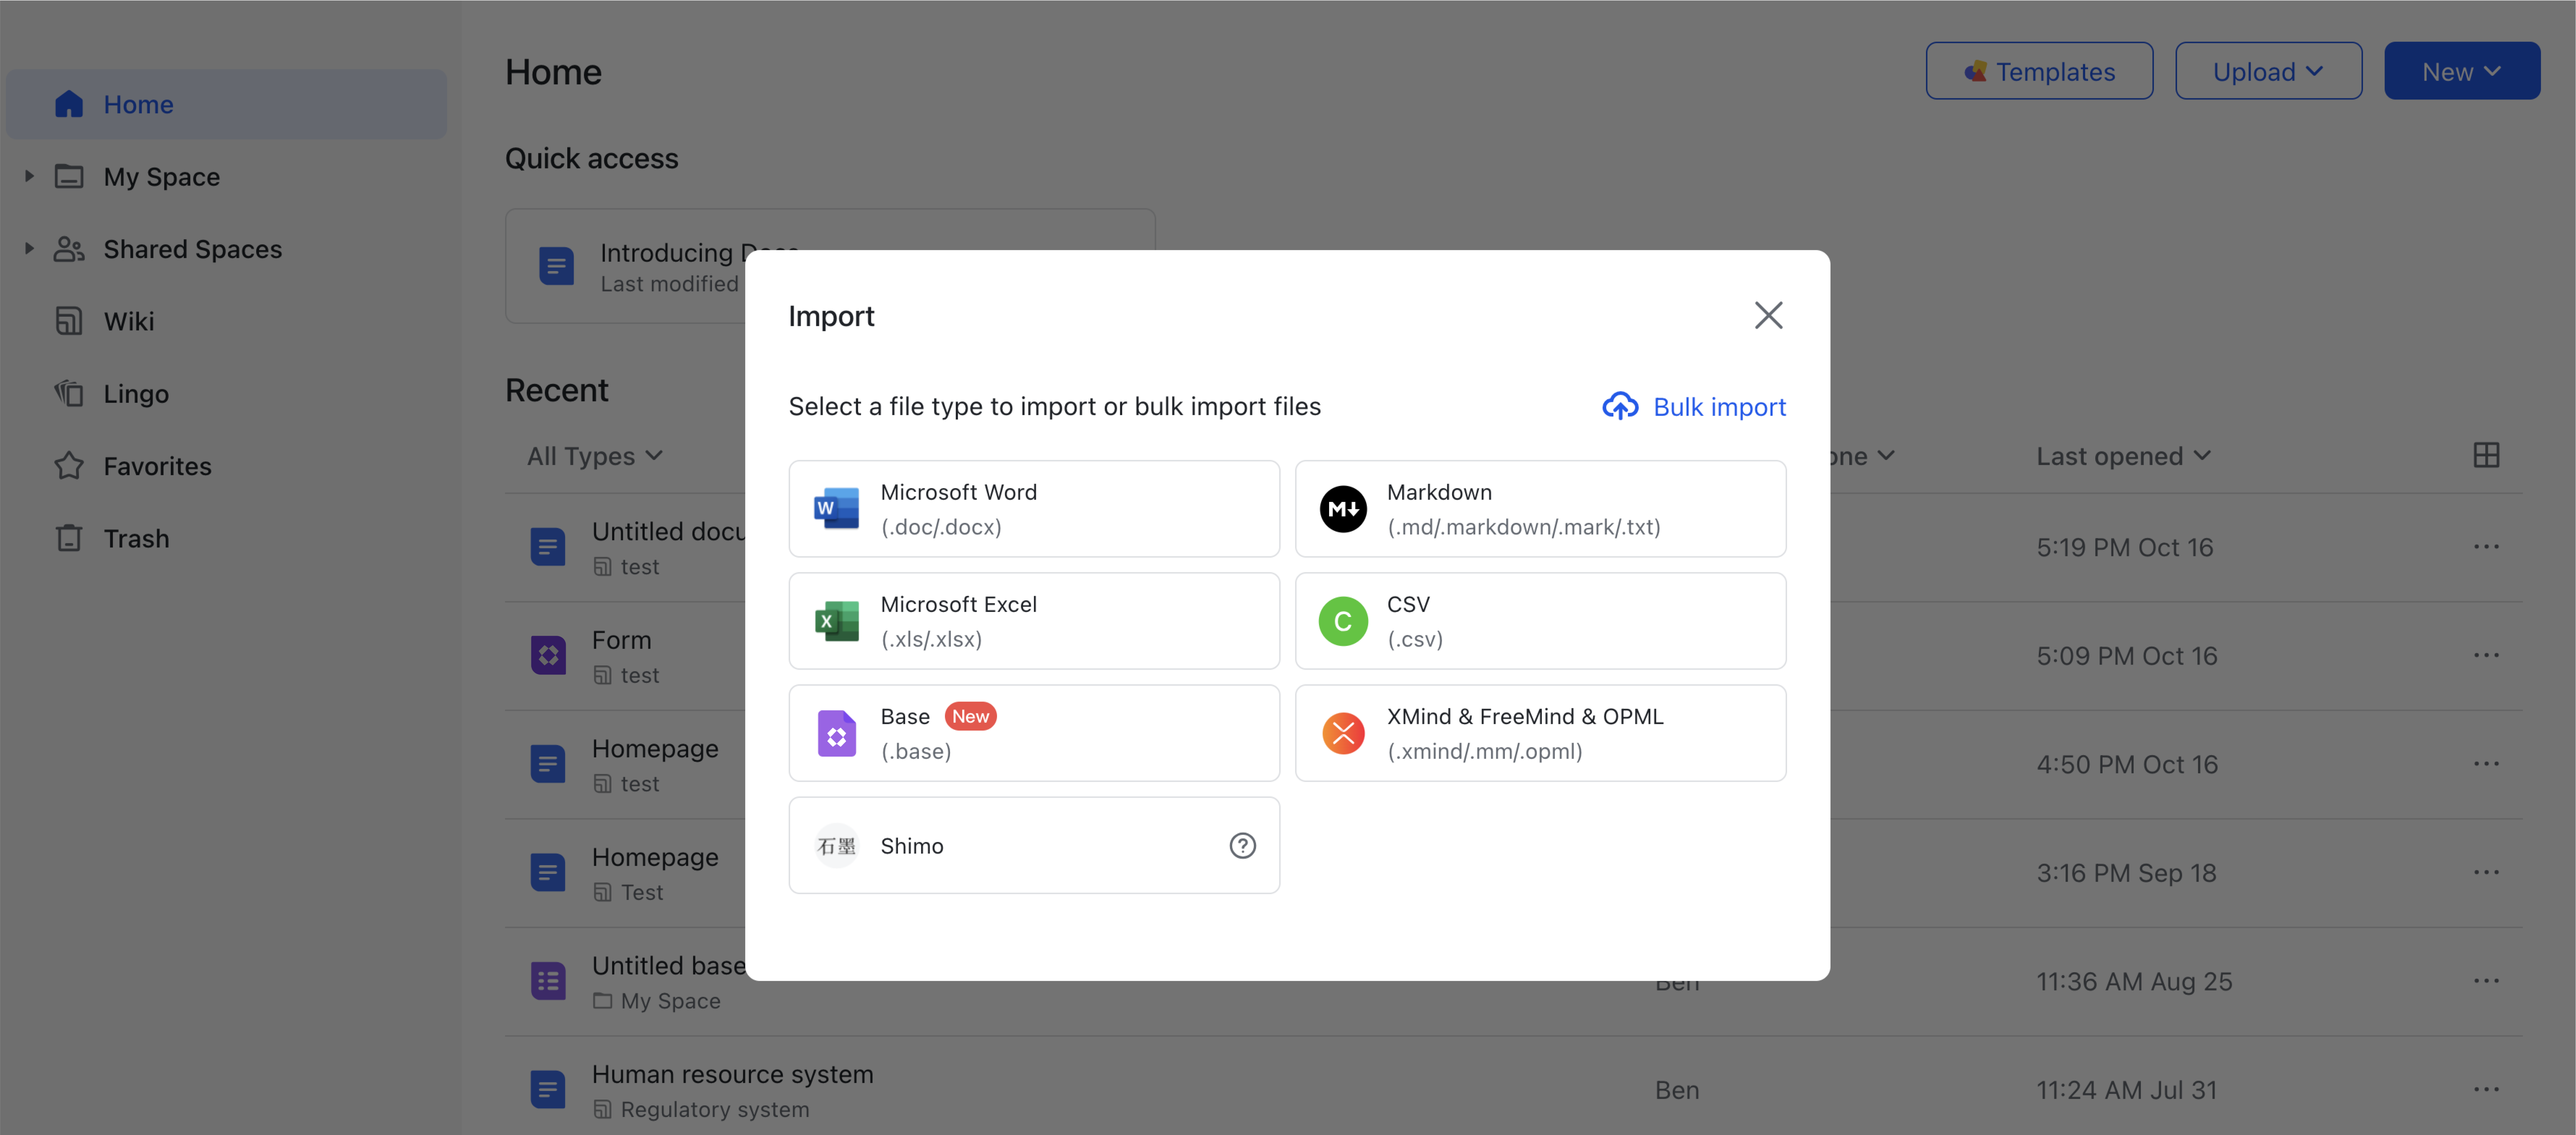
Import a spreadsheet
To migrate existing .xlsx, .xls, or .csv files, go to the Lark Docs homepage and click Upload > Import as New Docs. Select the file format and select the file to import, and the file will be converted into a Lark document.
Note:
- The import size limit varies based on the file format and the platform you're using to import:
- .xls or .xlsx format: From the Lark app, up to 20 MB can be imported. From the web, up to 800 MB can be imported, of which up to 20 MB can be non-image content.
- Other formats: Up to 20 MB, regardless of platform used.
250px|700px|reset
Note: Spreadsheet files can be imported as either Sheets or Base. To check which one is more suitable for your needs, see Use Sheets and Base.
Step 2: Collaborate online
Share with collaborators
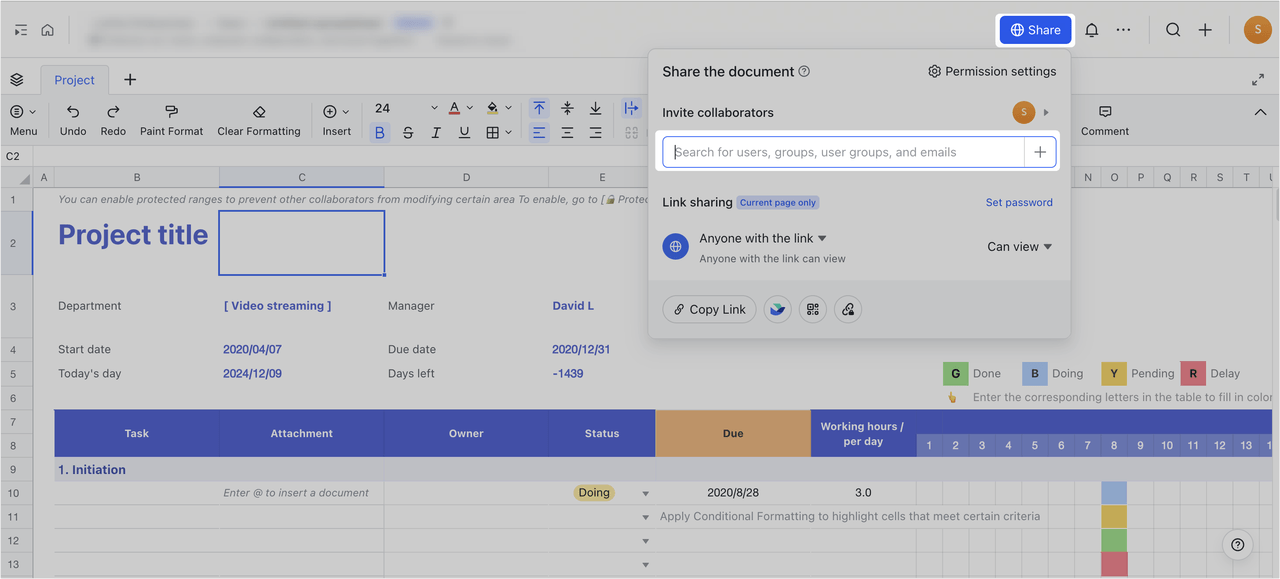
- Method 1: Share from the spreadsheet file
Click Share in the upper-right corner of the spreadsheet, and enter the users or groups you want to share with in the Invite collaborators field.
250px|700px|reset
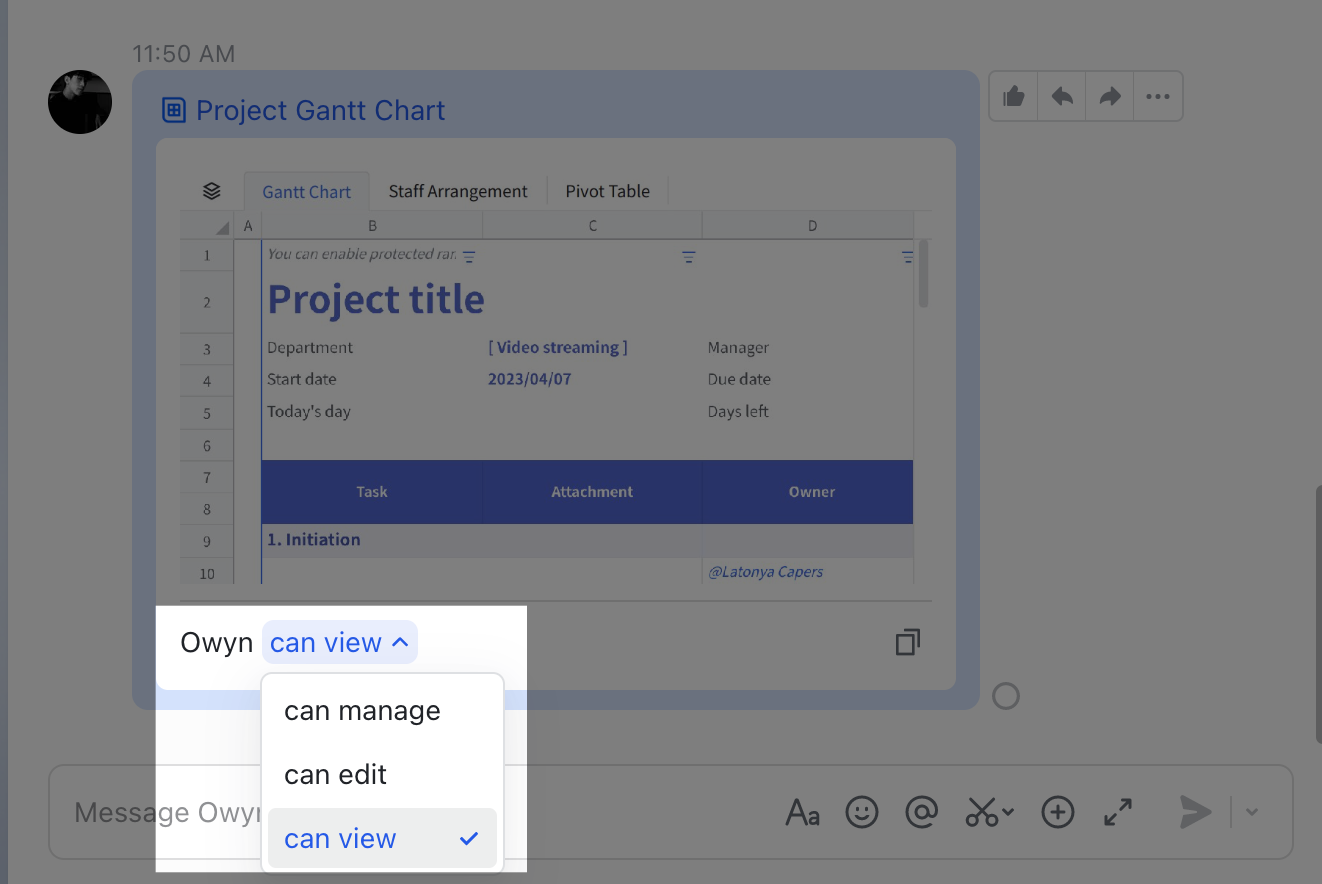
- Method 2: Share to a chat
Send the spreadsheet link to a Lark chat and select a permission setting to give access to the user.
250px|700px|reset
Mention others and add comments
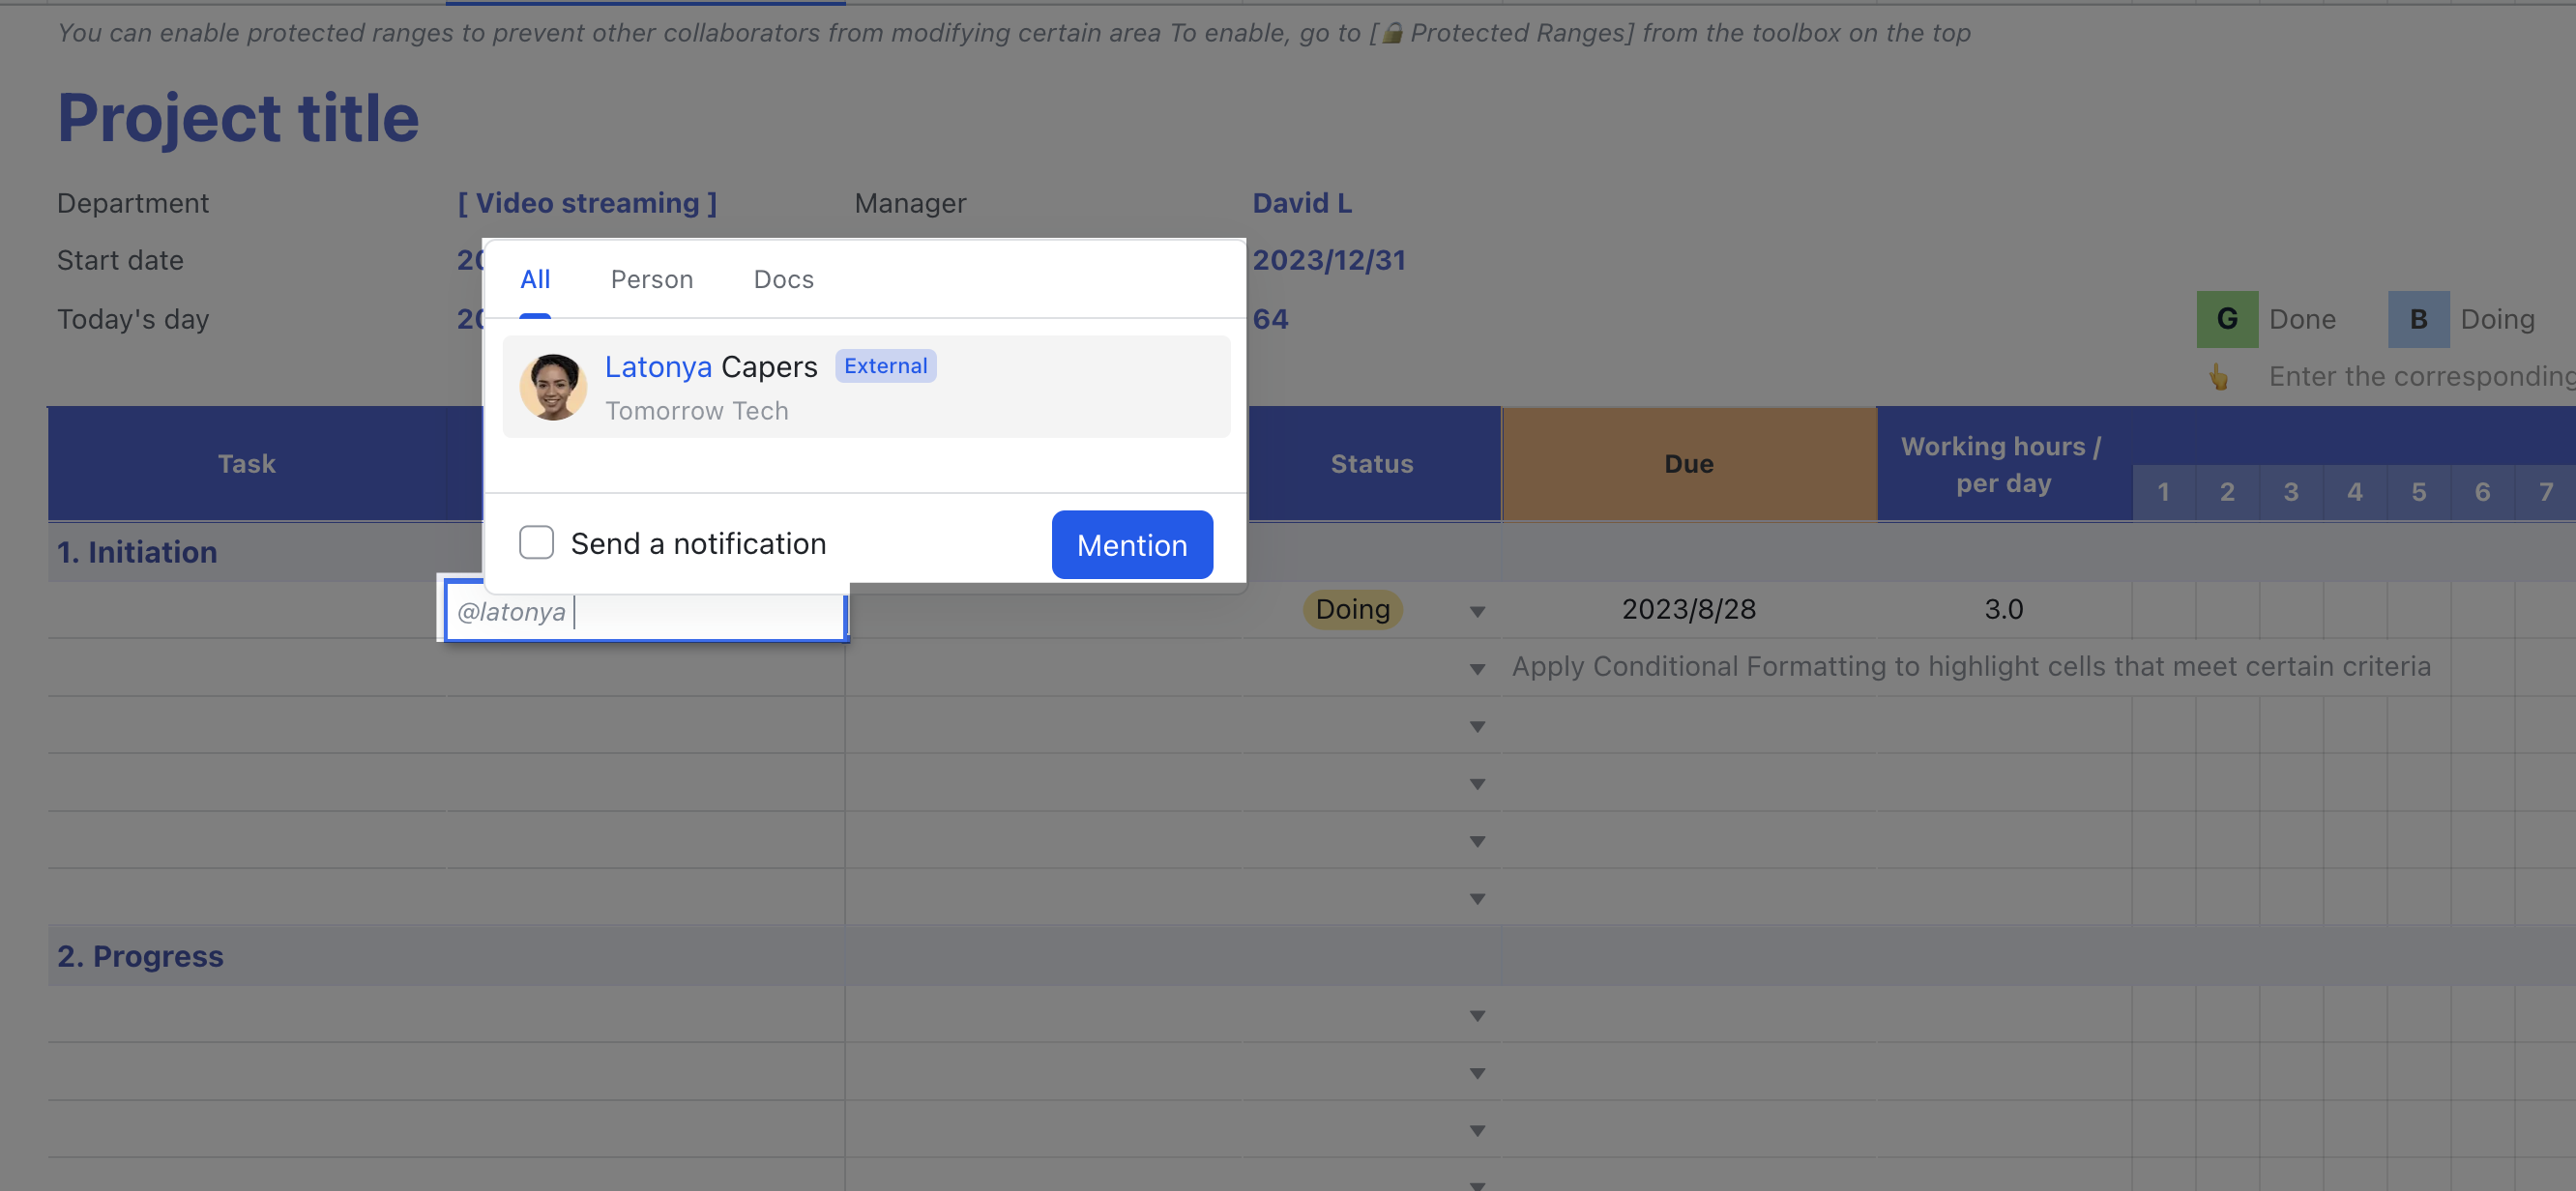
- Enter @[Name] in a cell to mention someone. Select Send a Notification to send them a Lark message, and they'll be able to click a link in the message to go to the spreadsheet.
250px|700px|reset
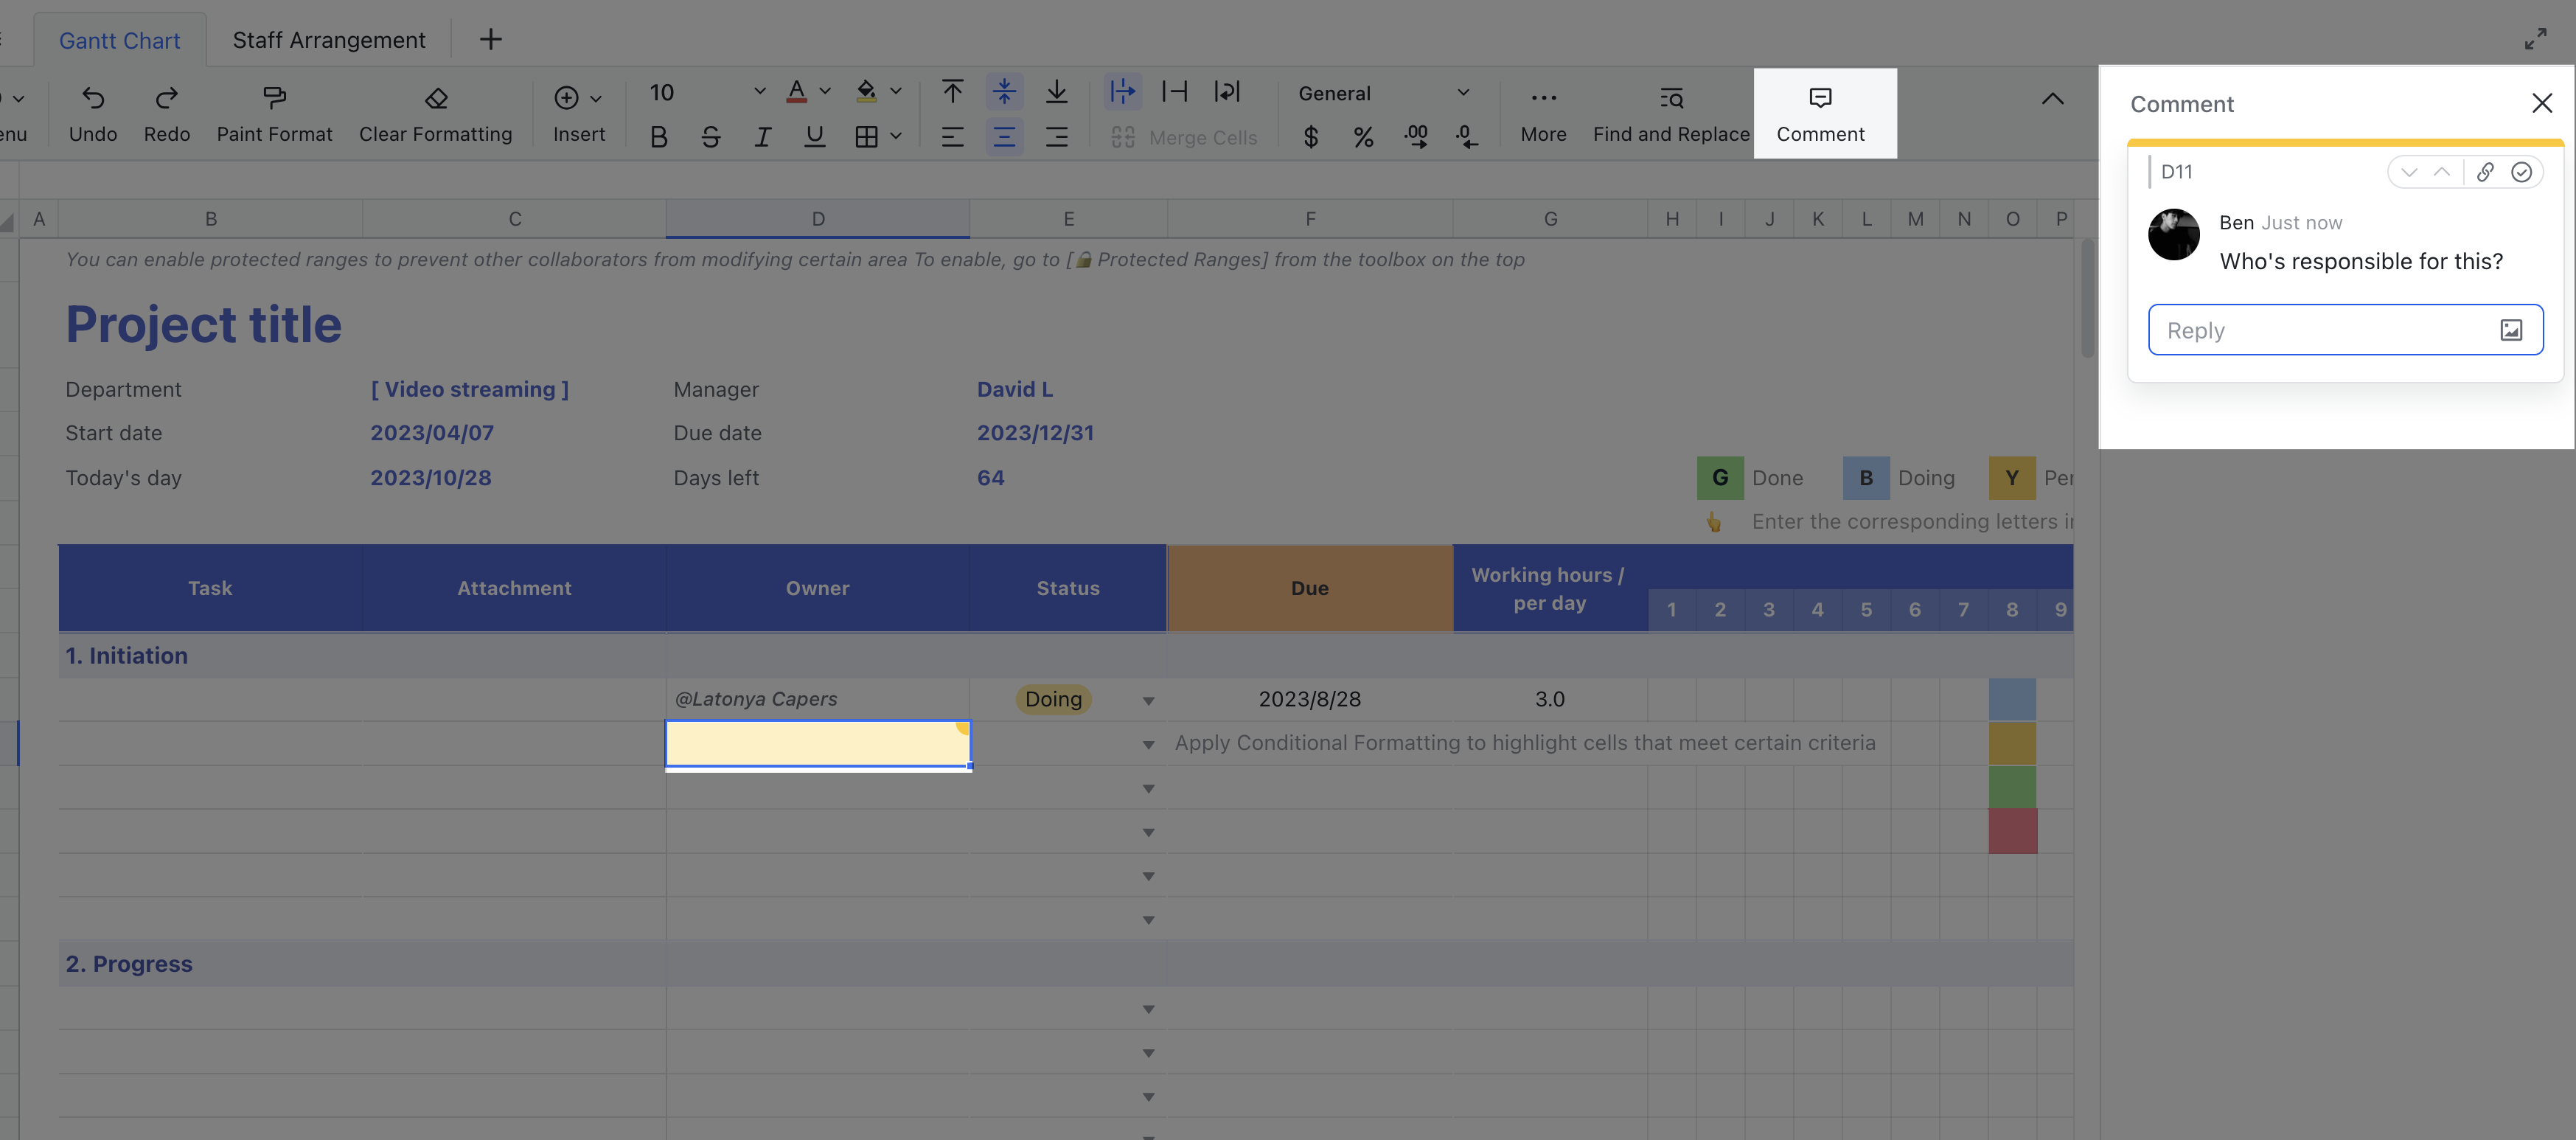
- Select the cell you want to comment on and click the Comment icon in the toolbar to add a comment. You can also use @ to mention someone in a comment.
250px|700px|reset
Restore historical data
When multiple people work on the same document, mistakes tend to happen. Luckily, there's an easy fix for that in Sheets.
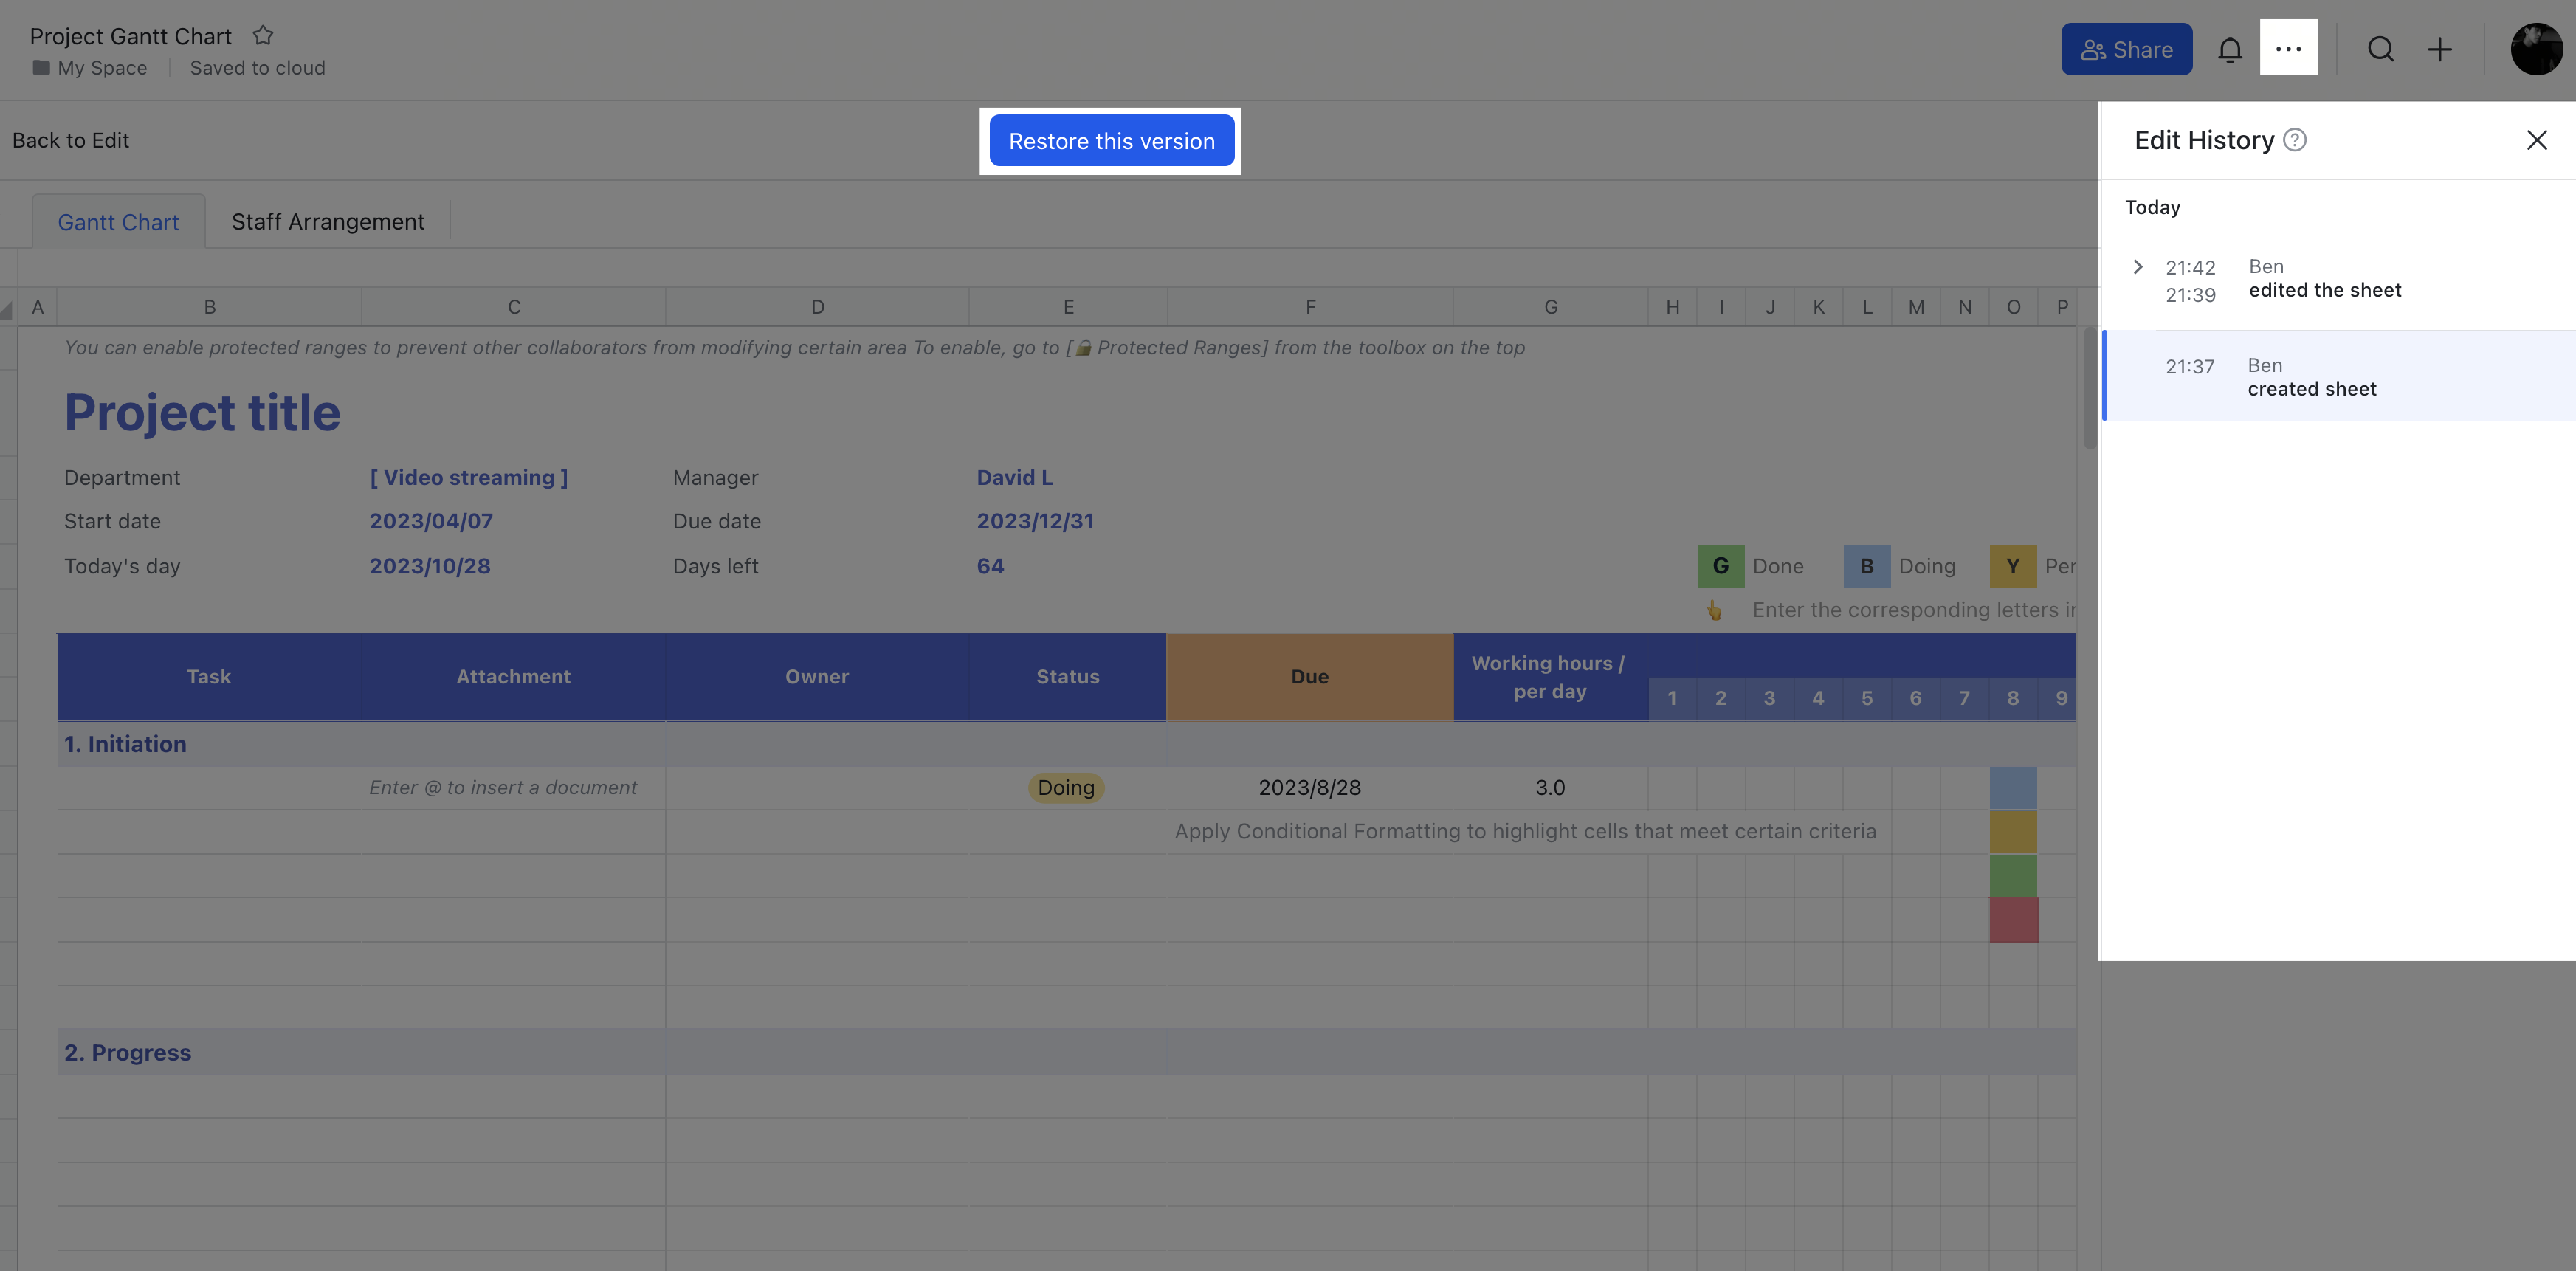
- Method 1: Restore a previous version
Click the ··· icon > Edit History to view edit records for the entire spreadsheet. Find the version you want and click Restore this version to restore it.
250px|700px|reset
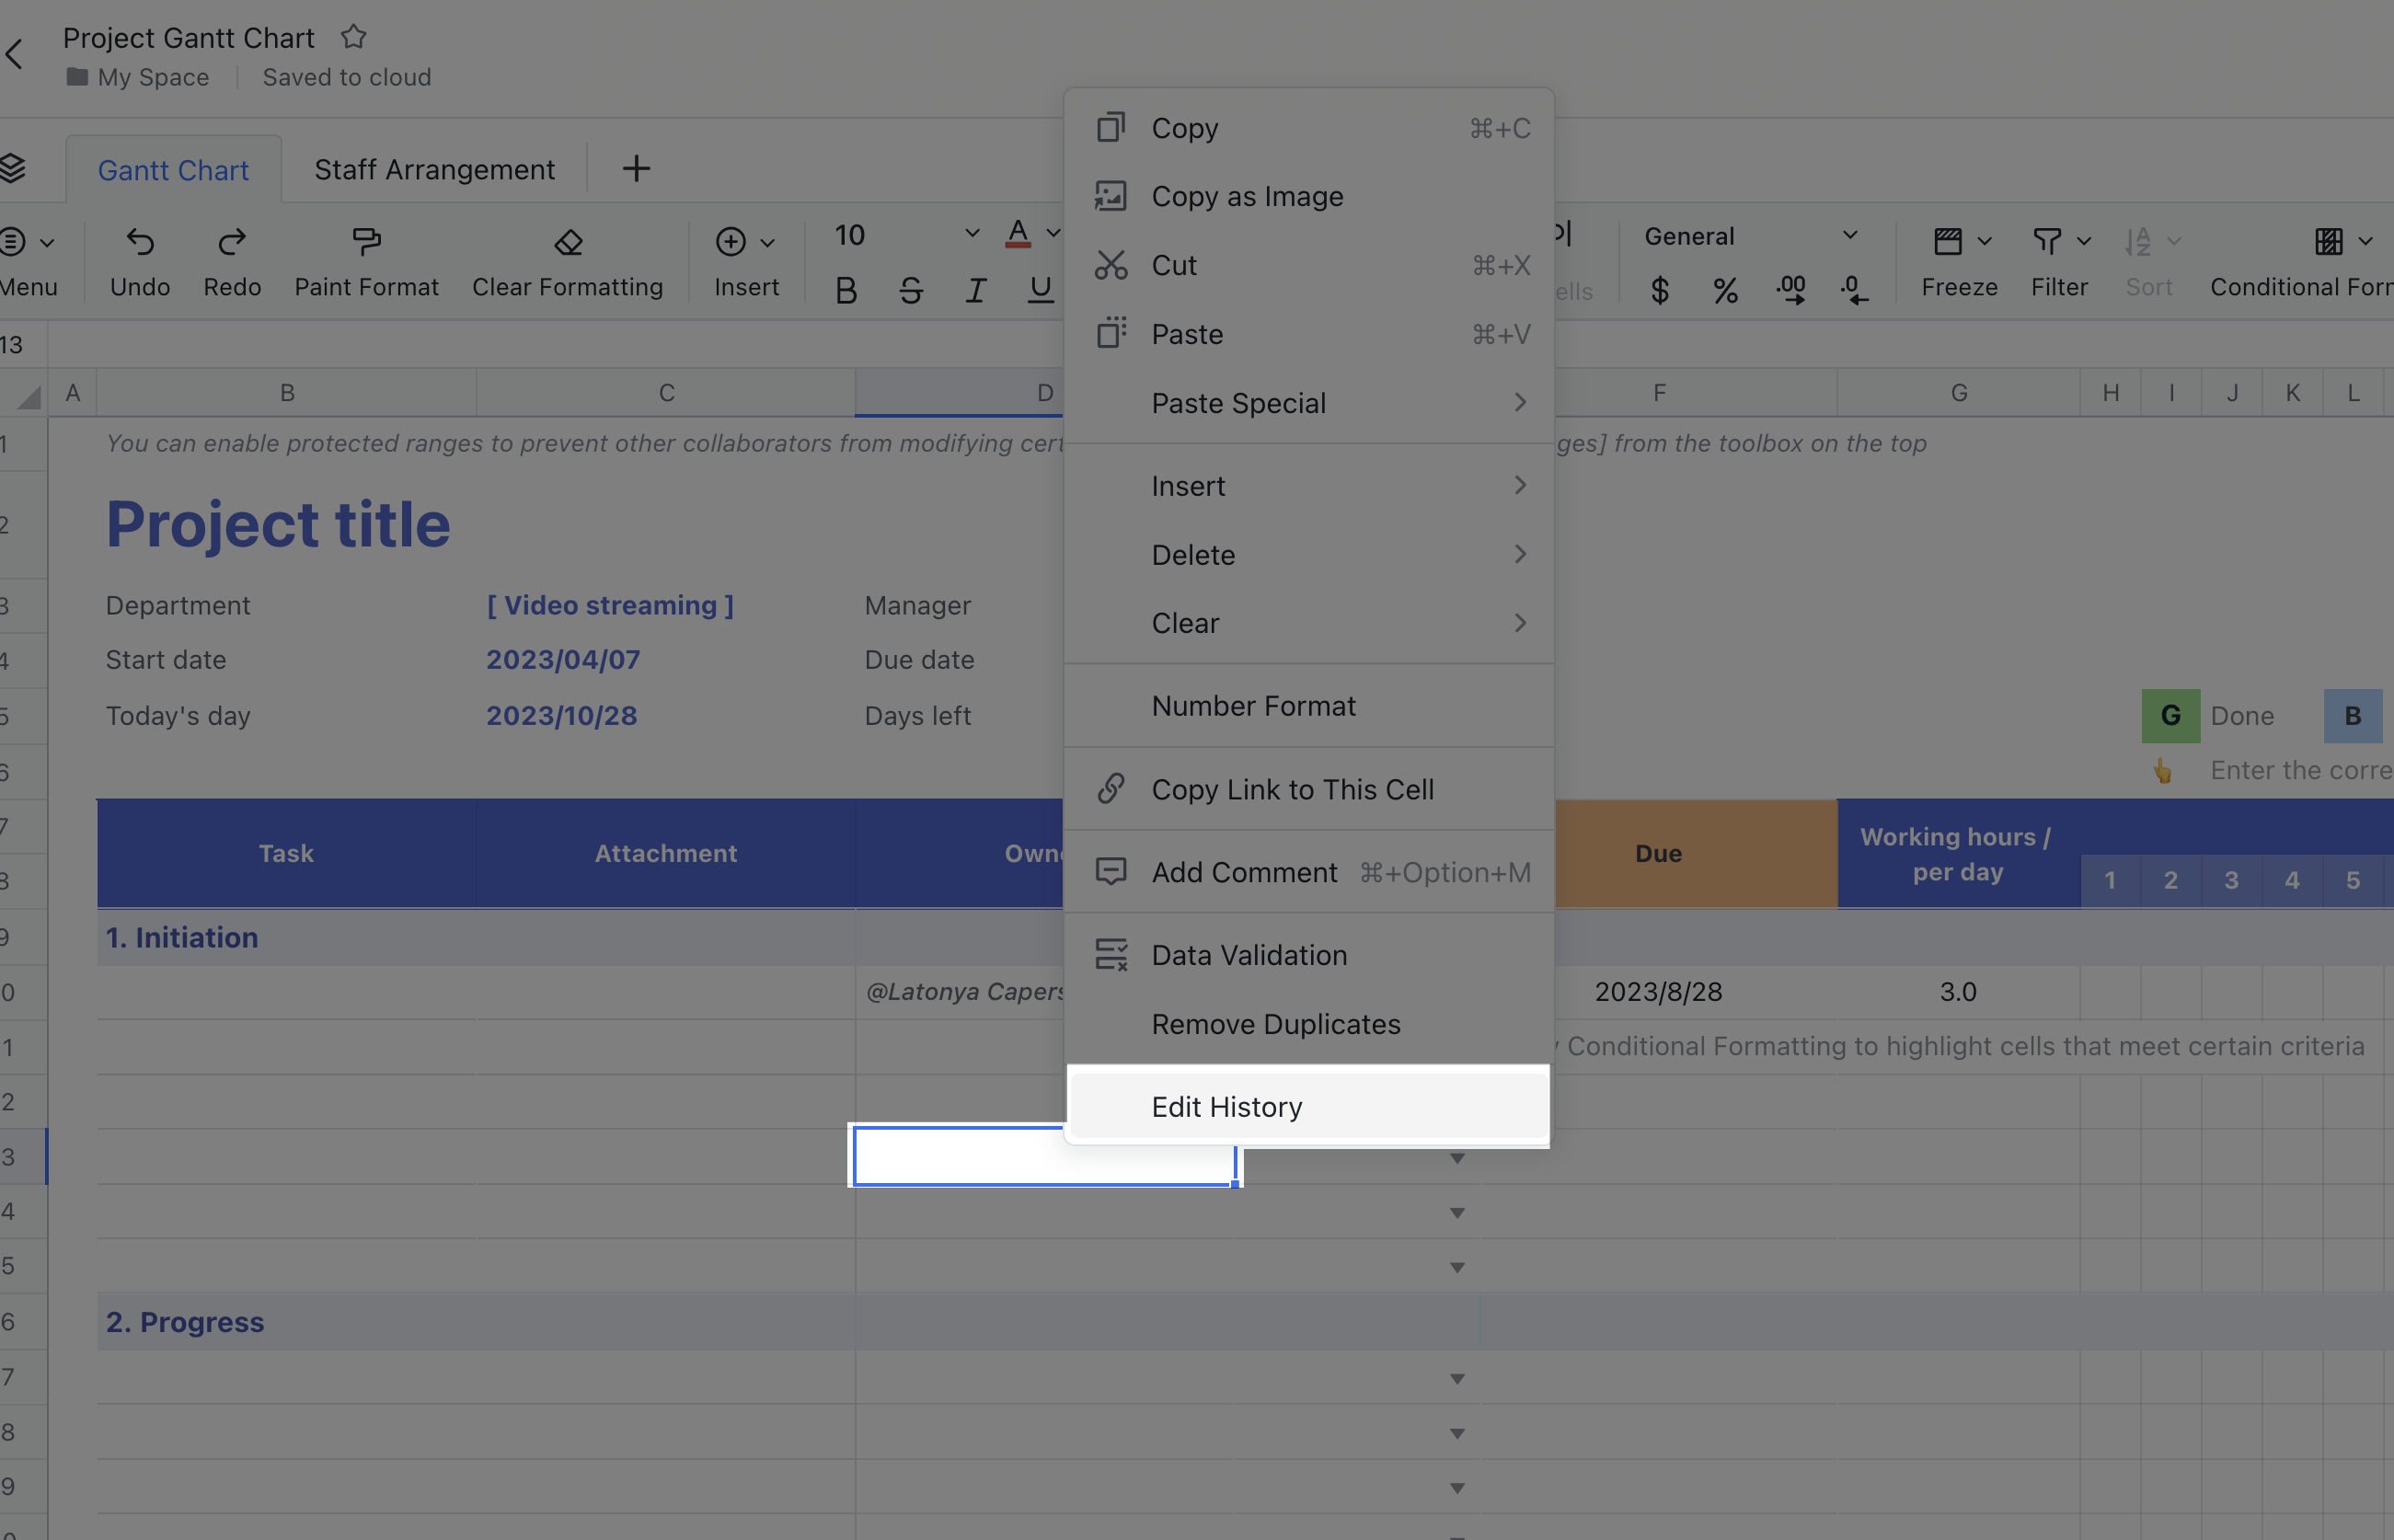
- Method 2: Restore a cell
To restore just one cell, right-click the cell, and select Edit History to view the cell's edit record. You can then copy and paste the data from the record to restore it.
250px|700px|reset
Step 3: Edit cells and adjust the page layout
Edit cells
Double-click a cell to enter text, numbers, and formulas. You can also click a cell to:
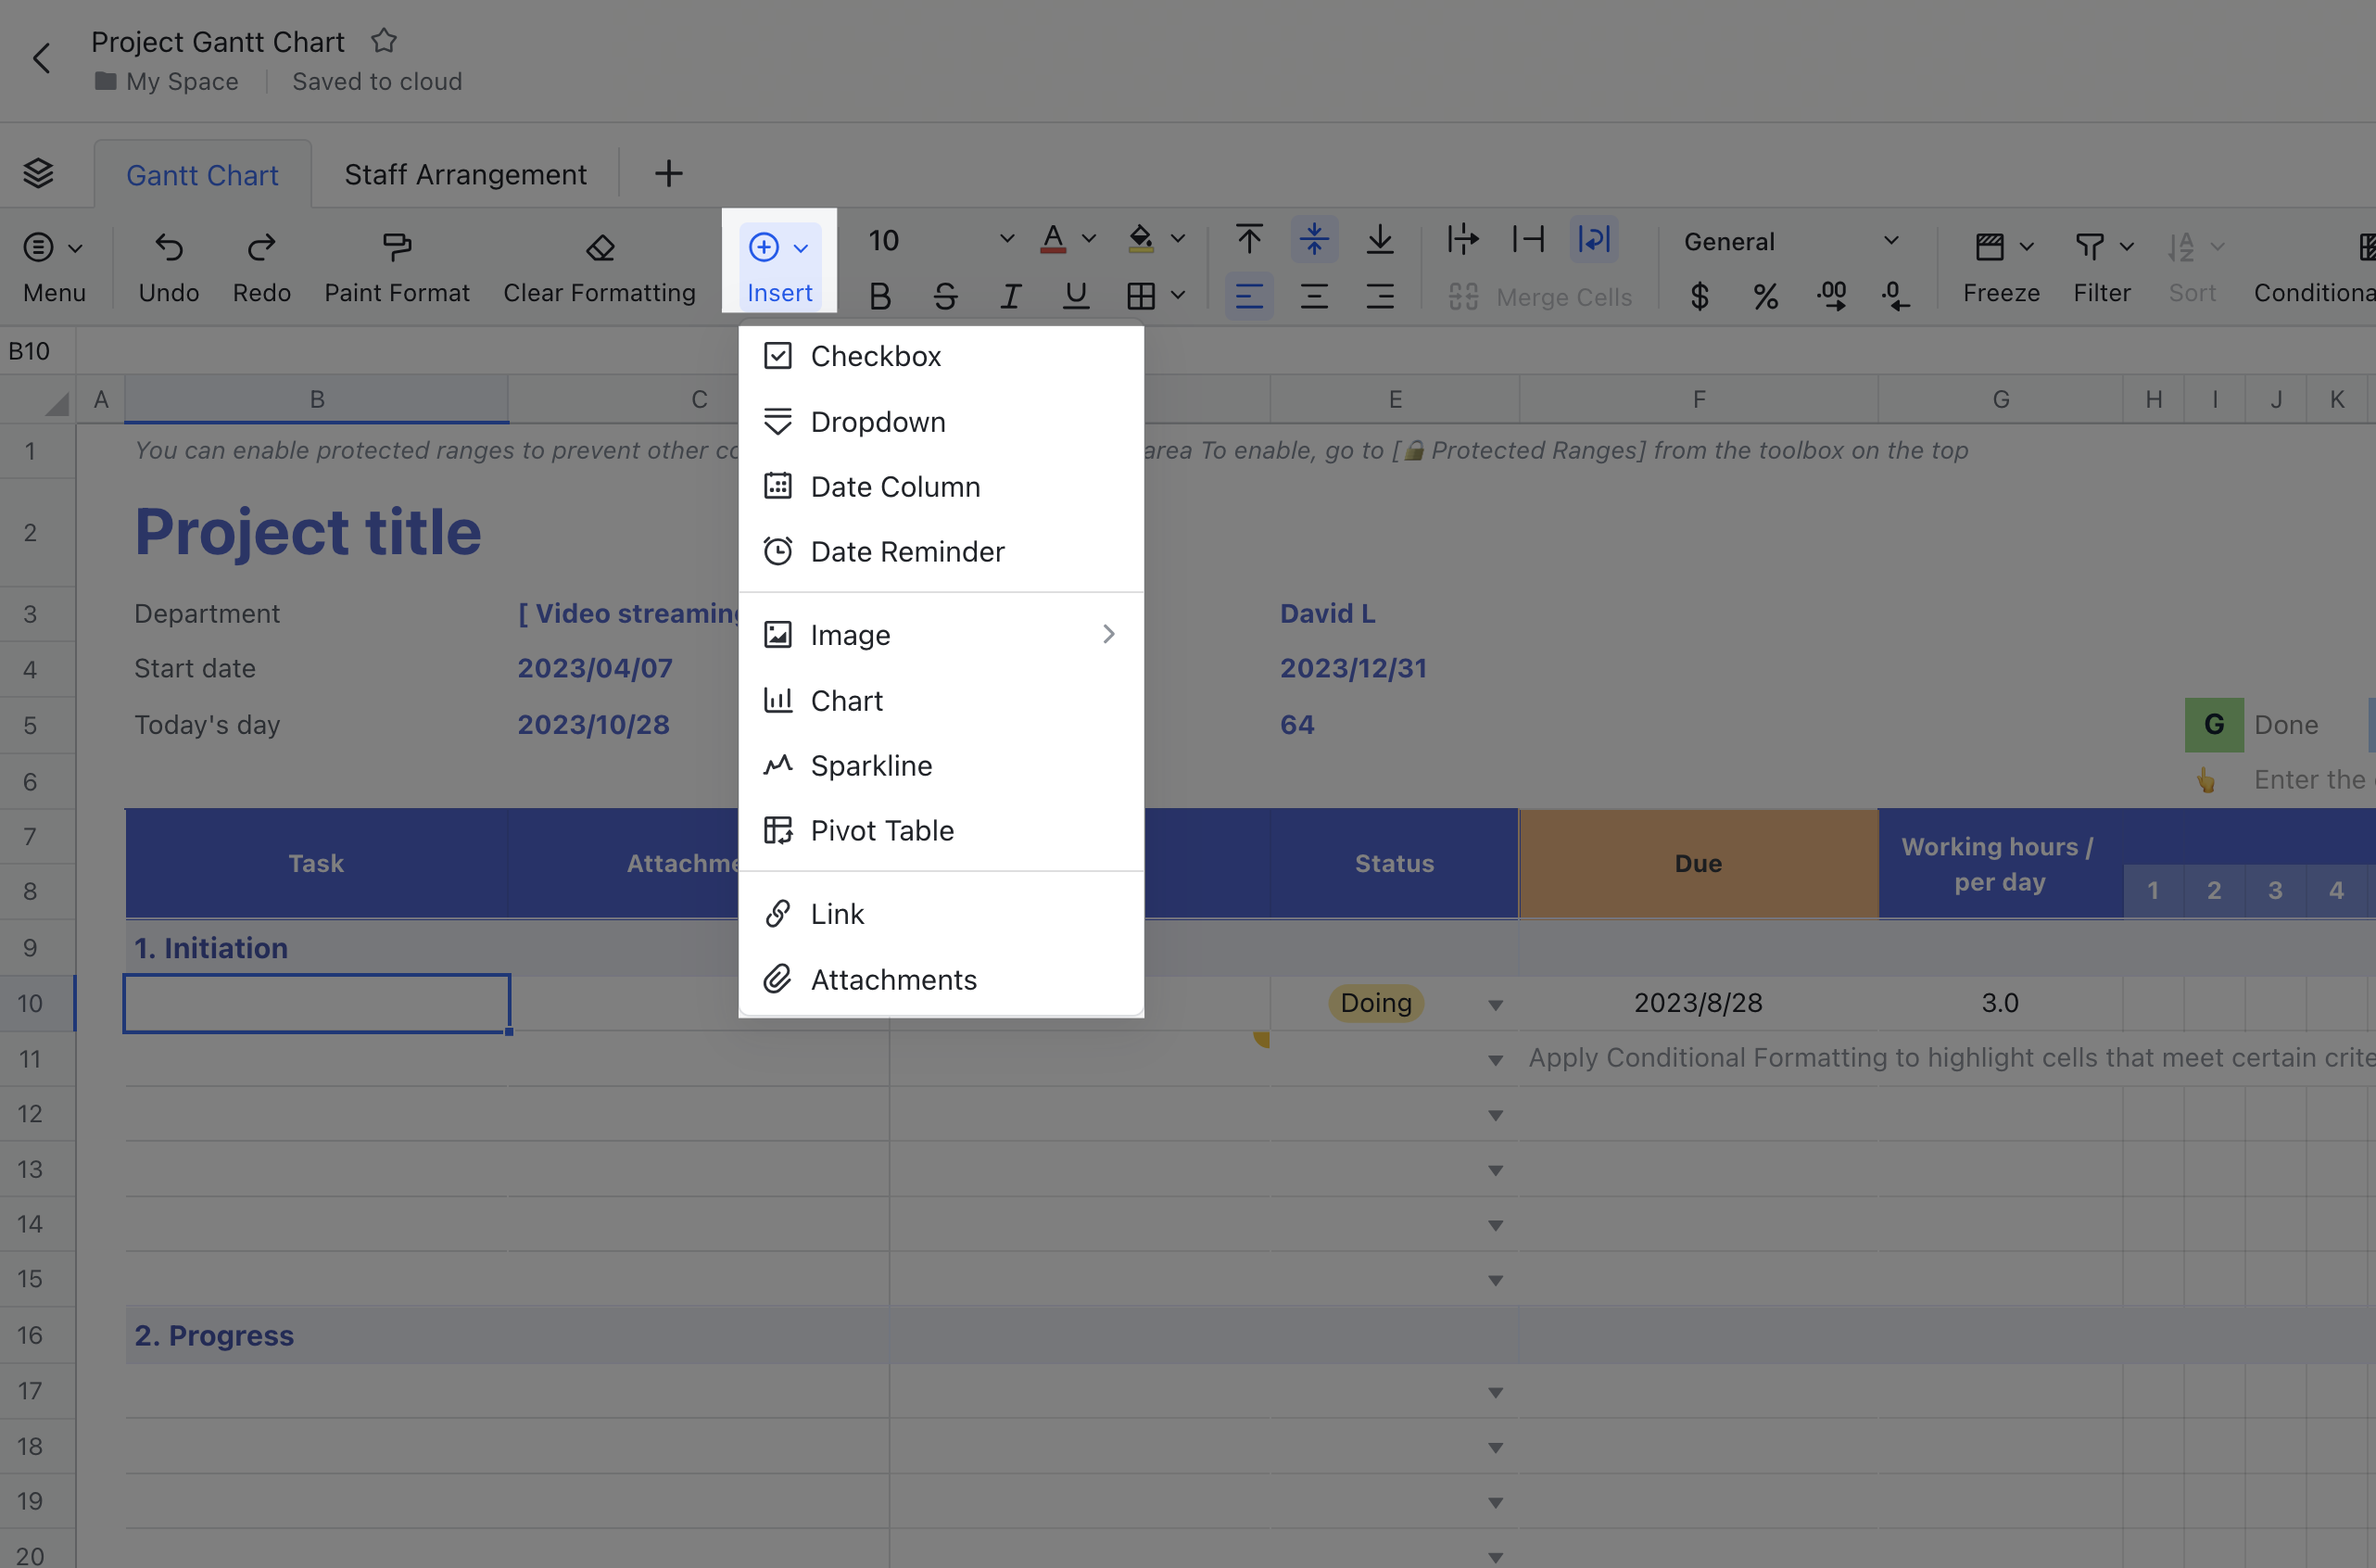
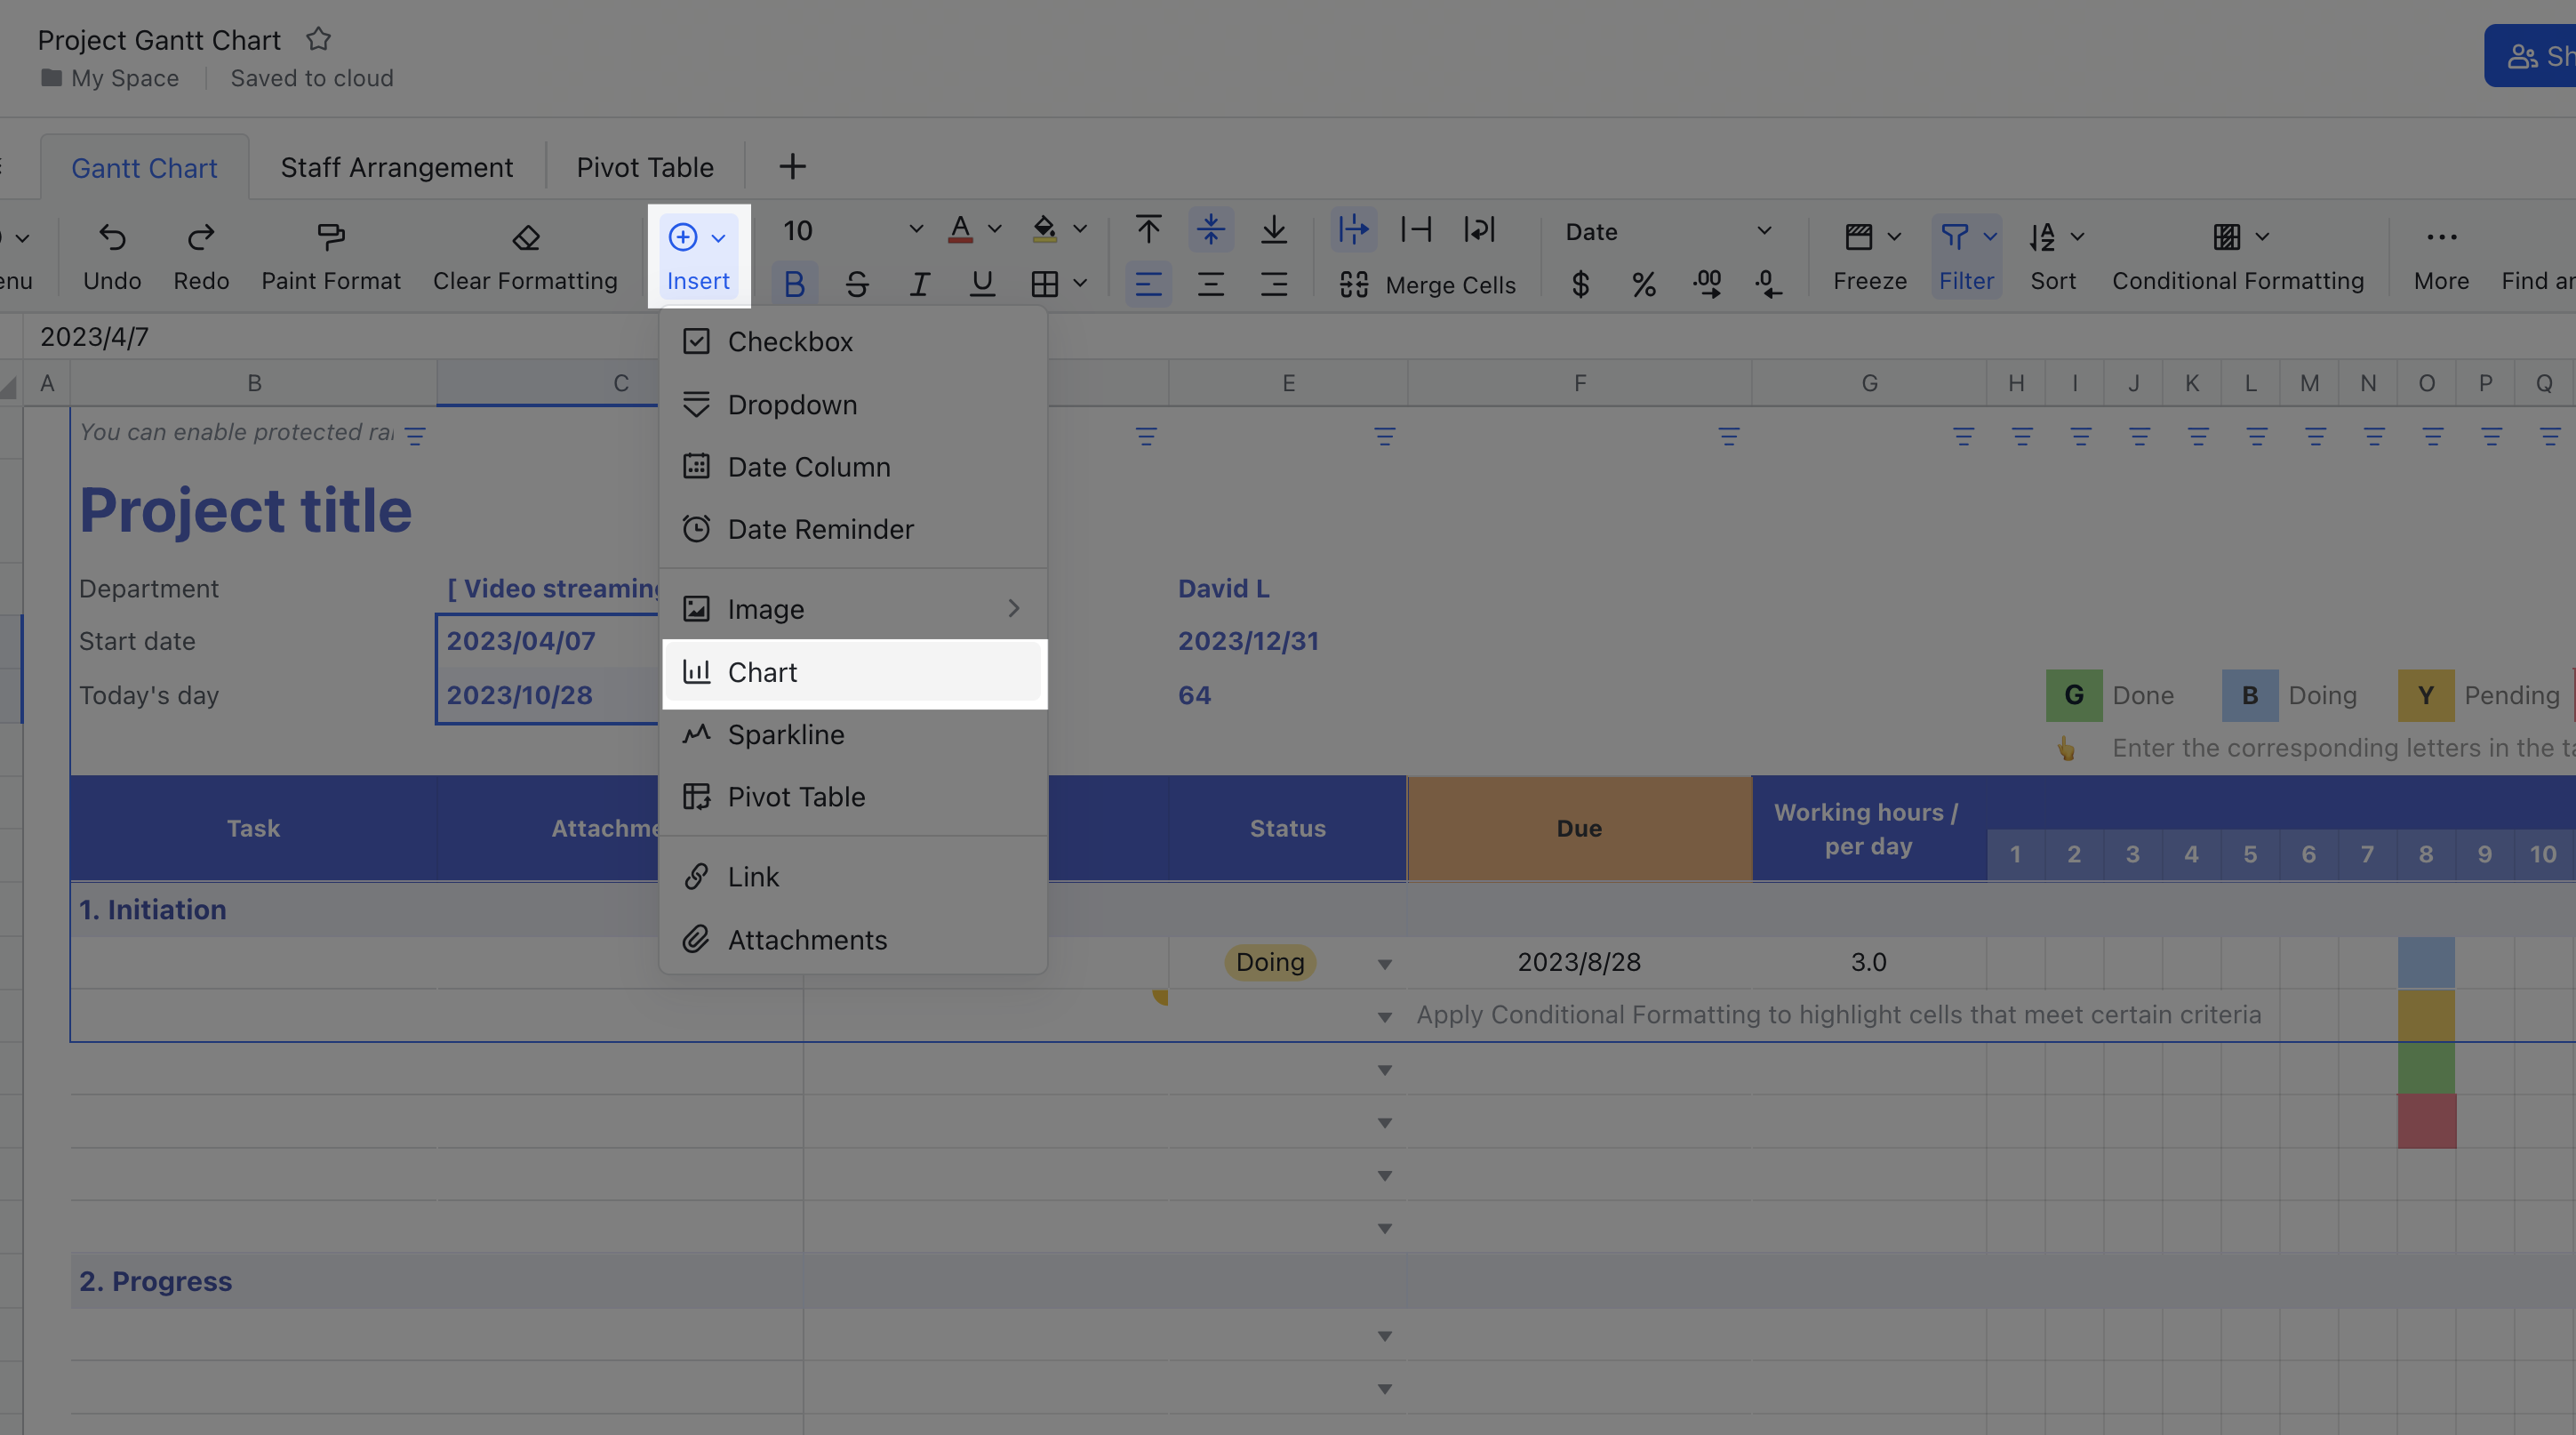
- Insert content: Click Insert in the toolbar and select images, links, charts, attachments, drop-down lists, date reminders, and more.
250px|700px|reset
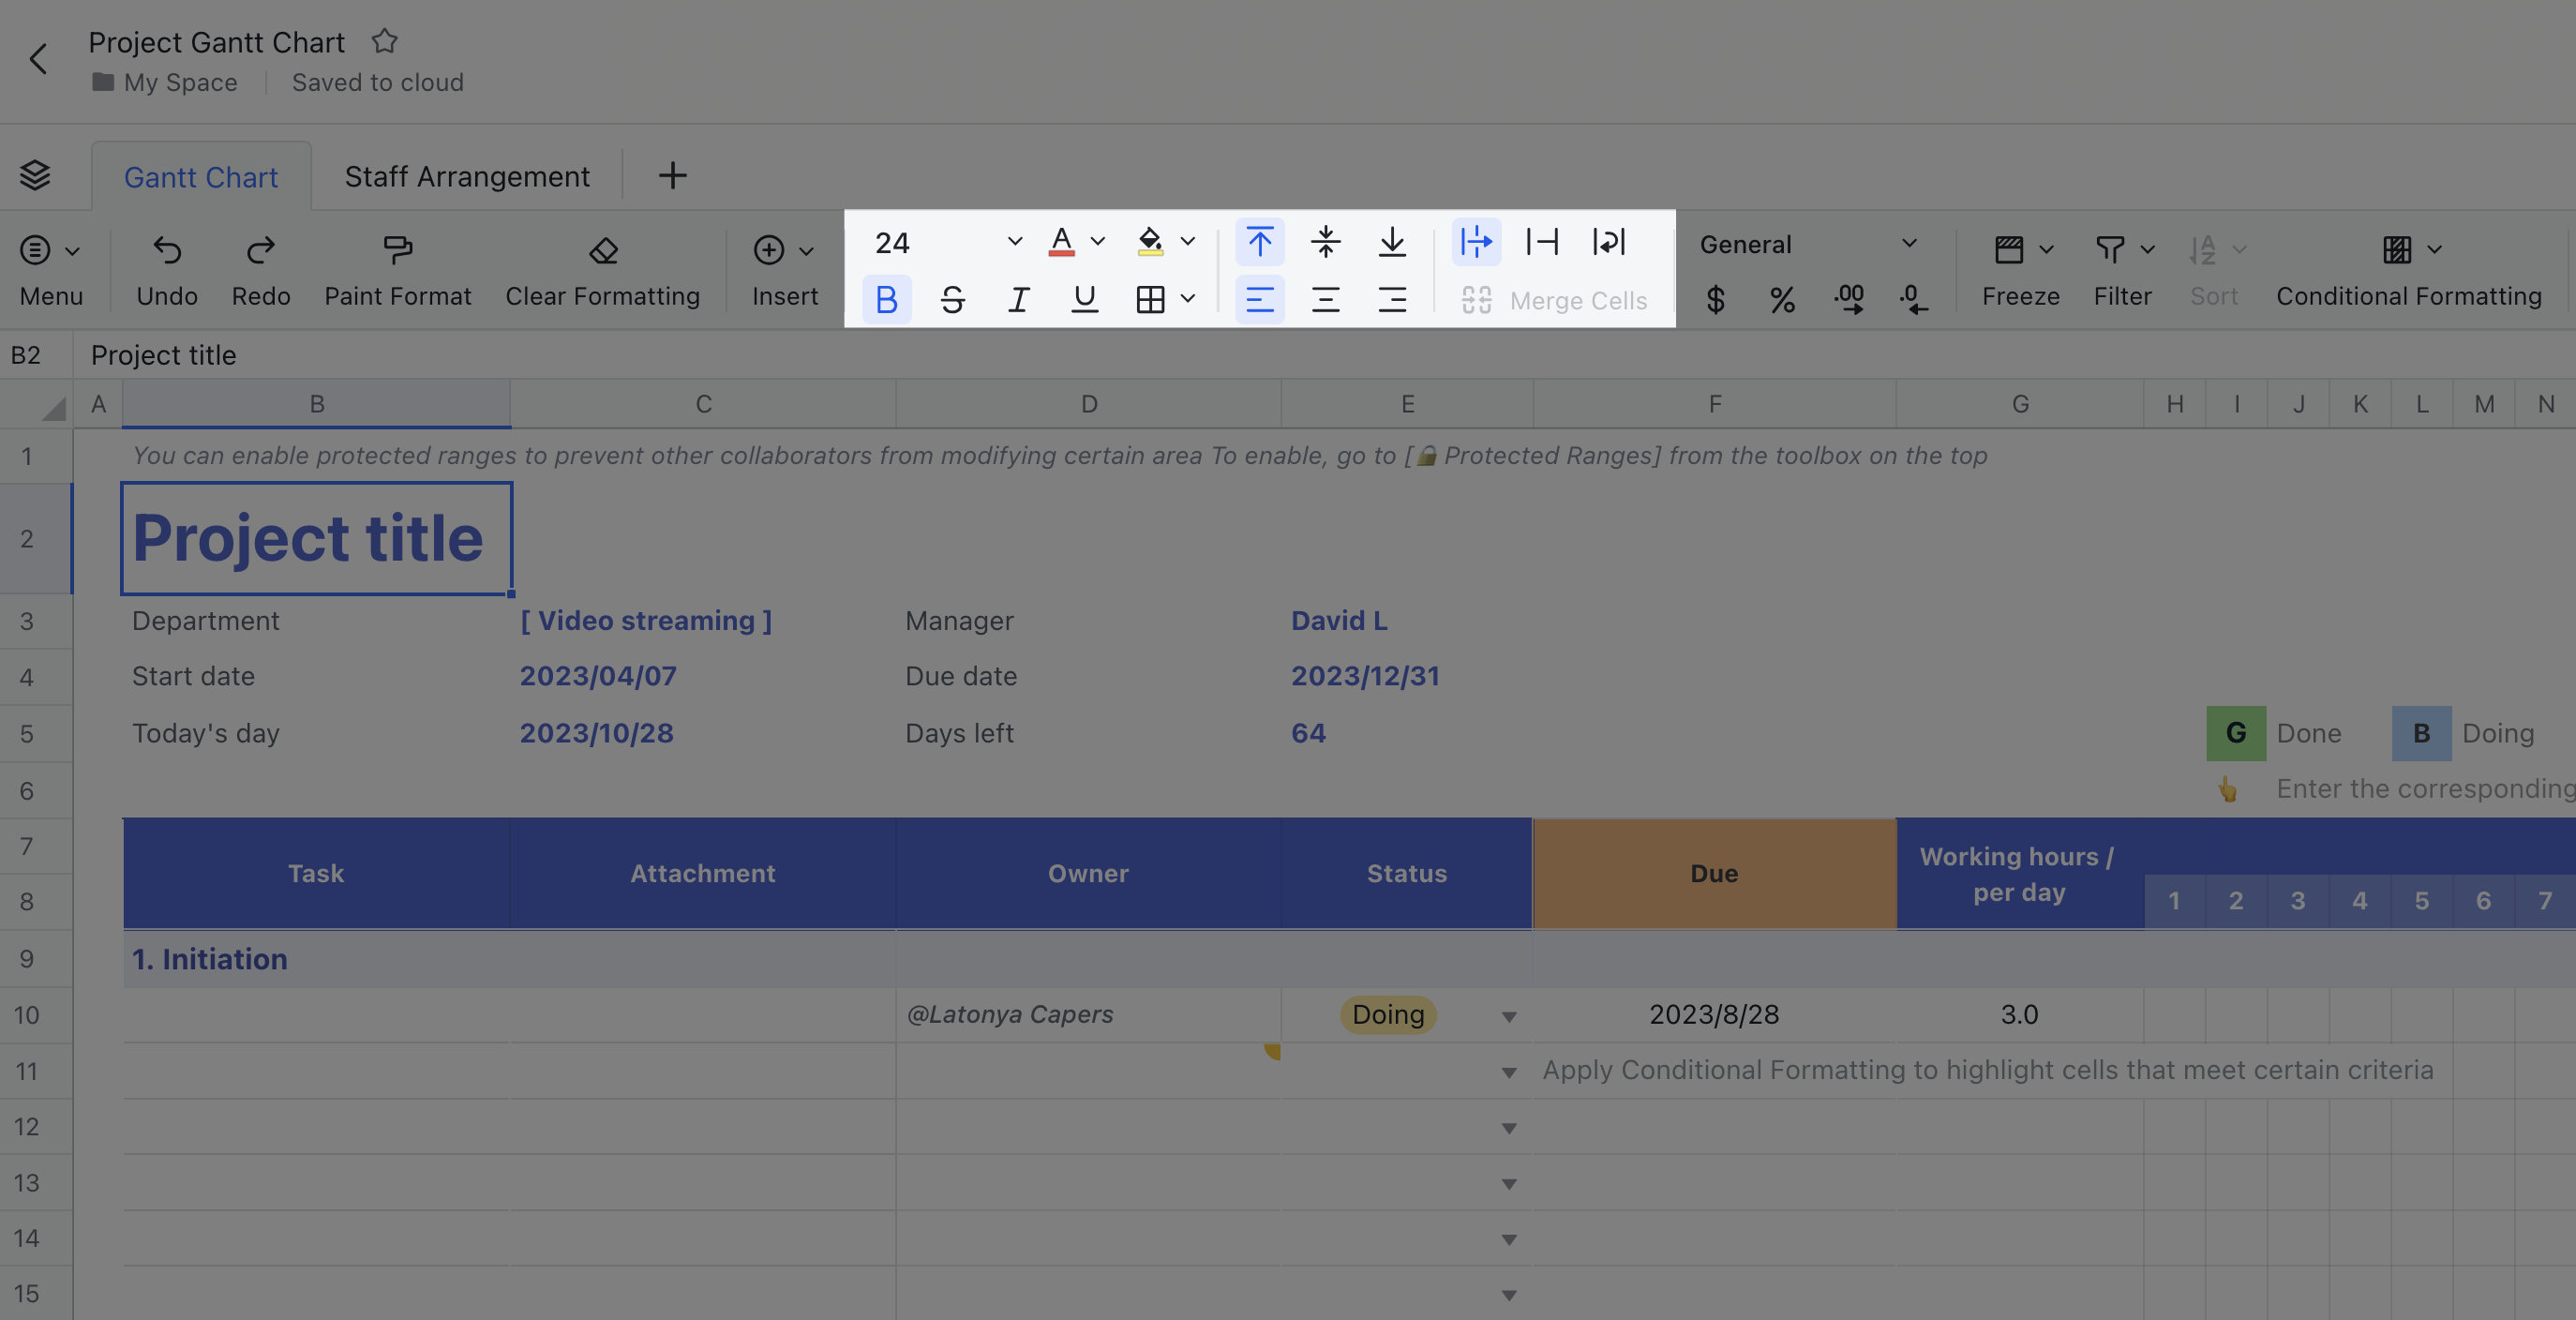
- Set style: Adjust the font size, style, and color, background color, and alignment from the toolbar. For details, see Set content styles for cells.
250px|700px|reset
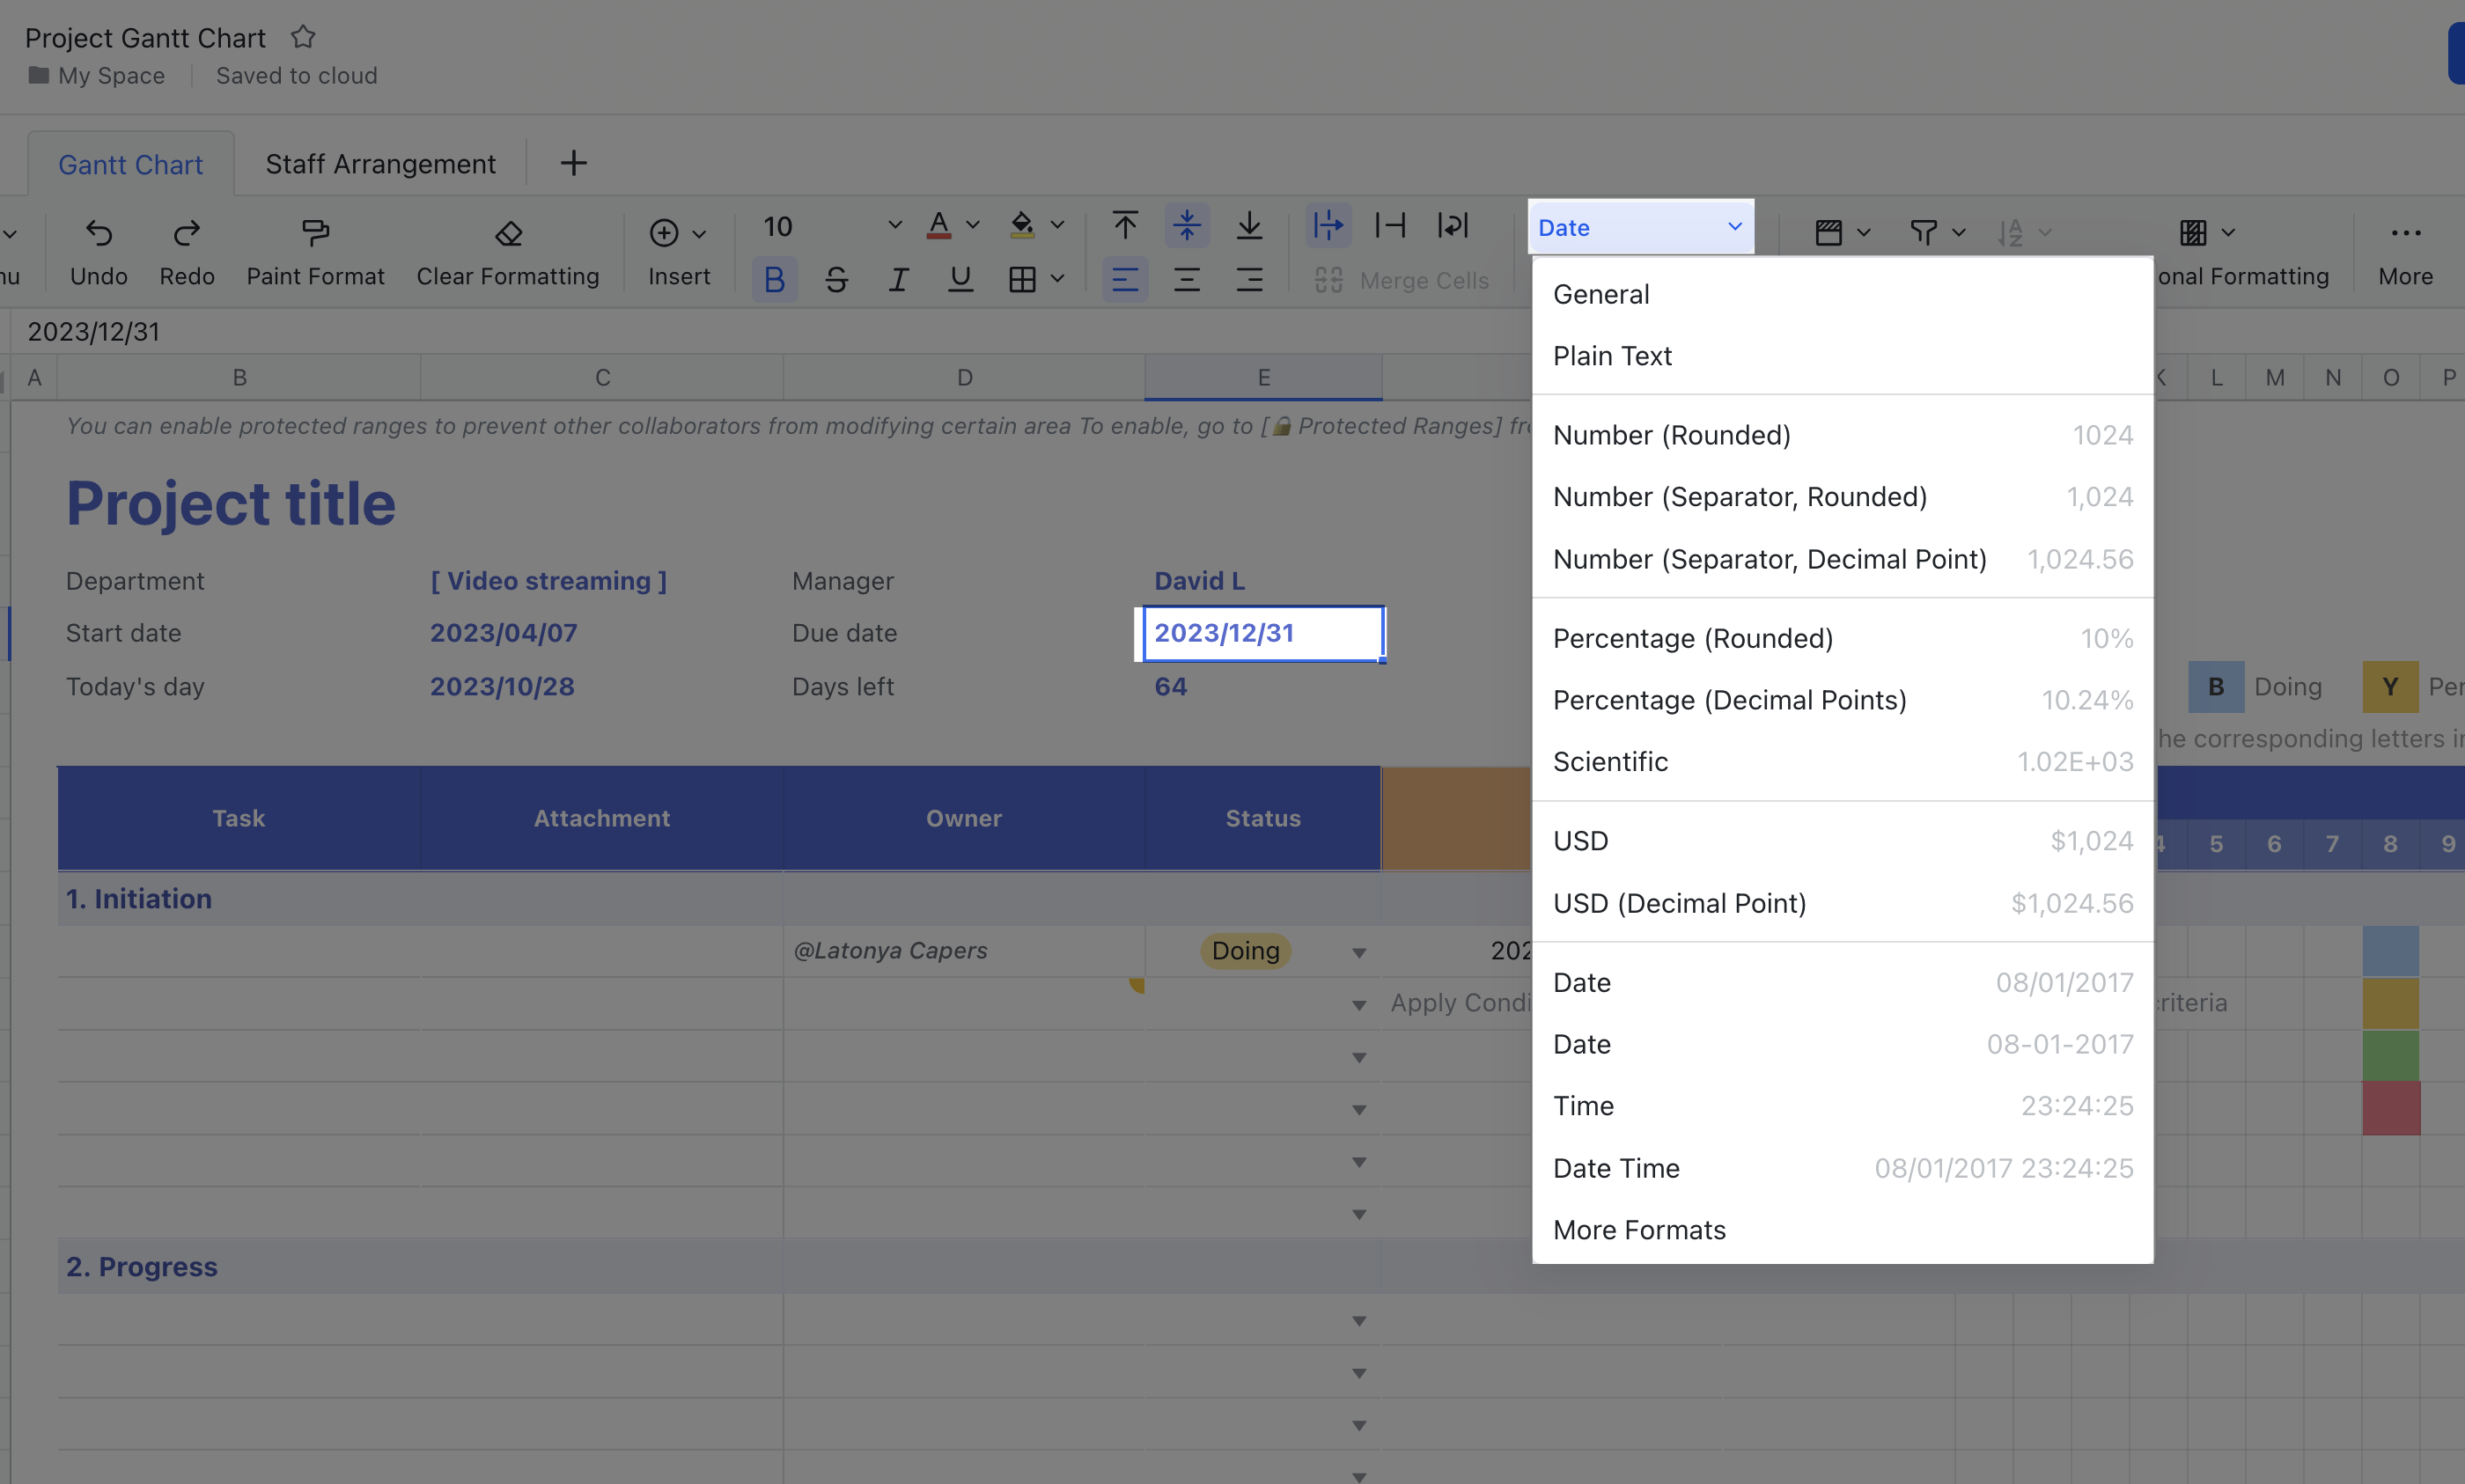
- Set data format: Click the Format field in the toolbar and select a format, such as Number, Date, Currency, Percentage, and more. You can also customize your own number formats by clicking More Formats > Custom. For details, see Customize number formats in Sheets.
250px|700px|reset
Adjust page layout
In addition to adjusting the row height and column width, you can do the following to optimize how your data is displayed:
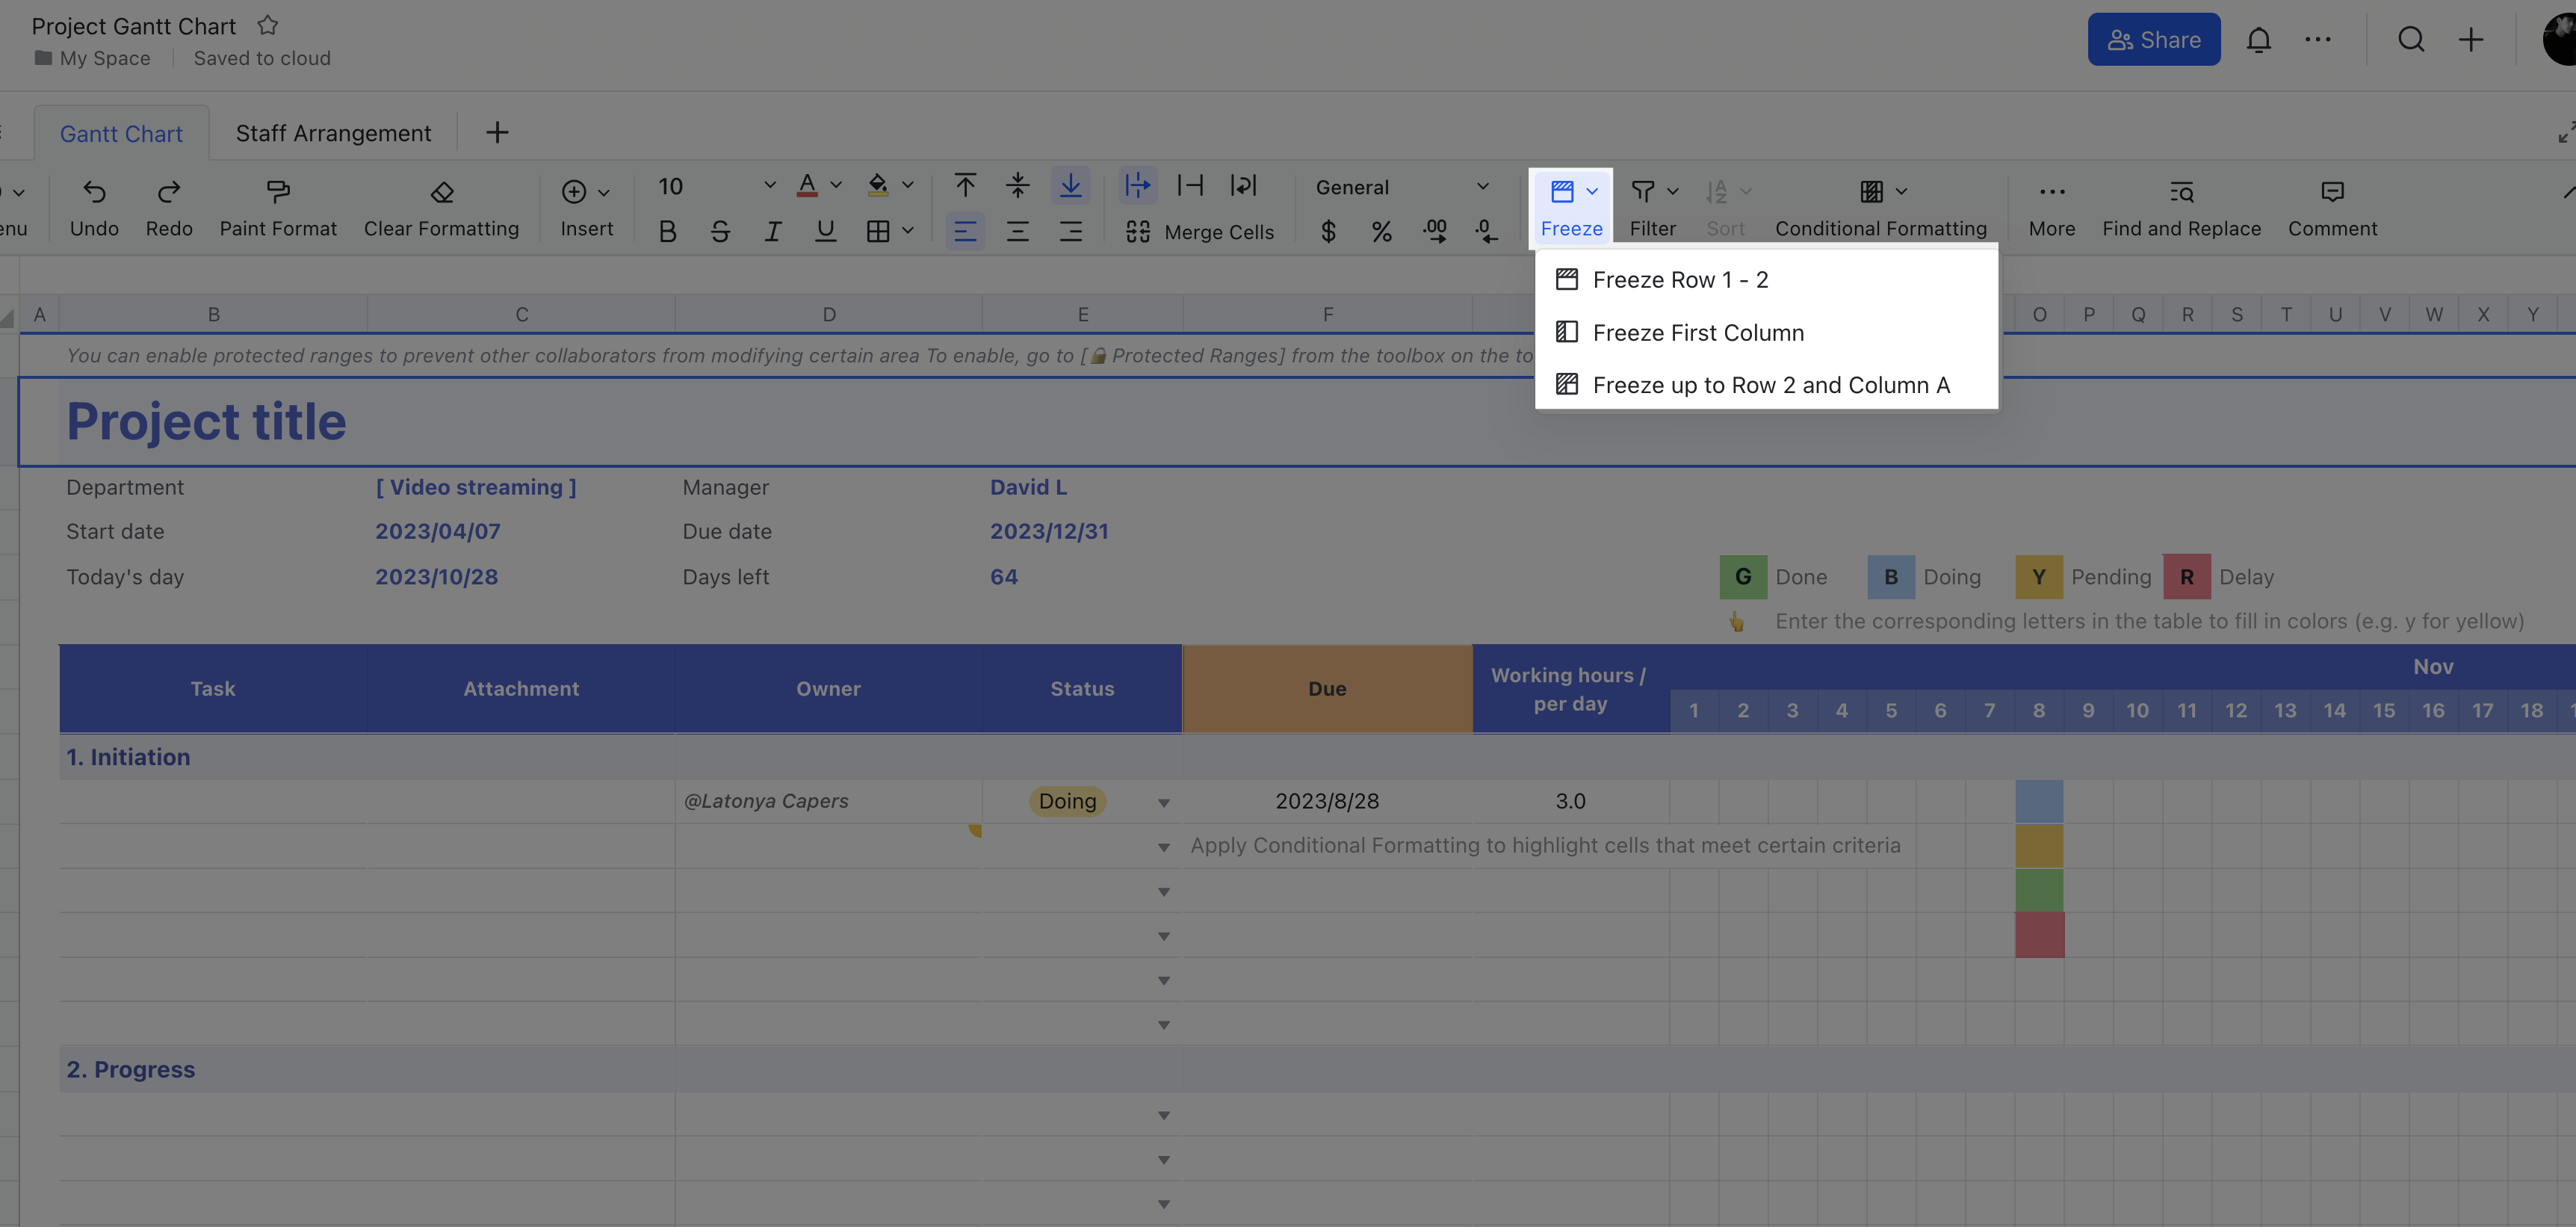
- Freeze rows/columns: Frozen rows and columns will not move as you scroll up and down or across the sheet, making it easy to reference key information.
250px|700px|reset
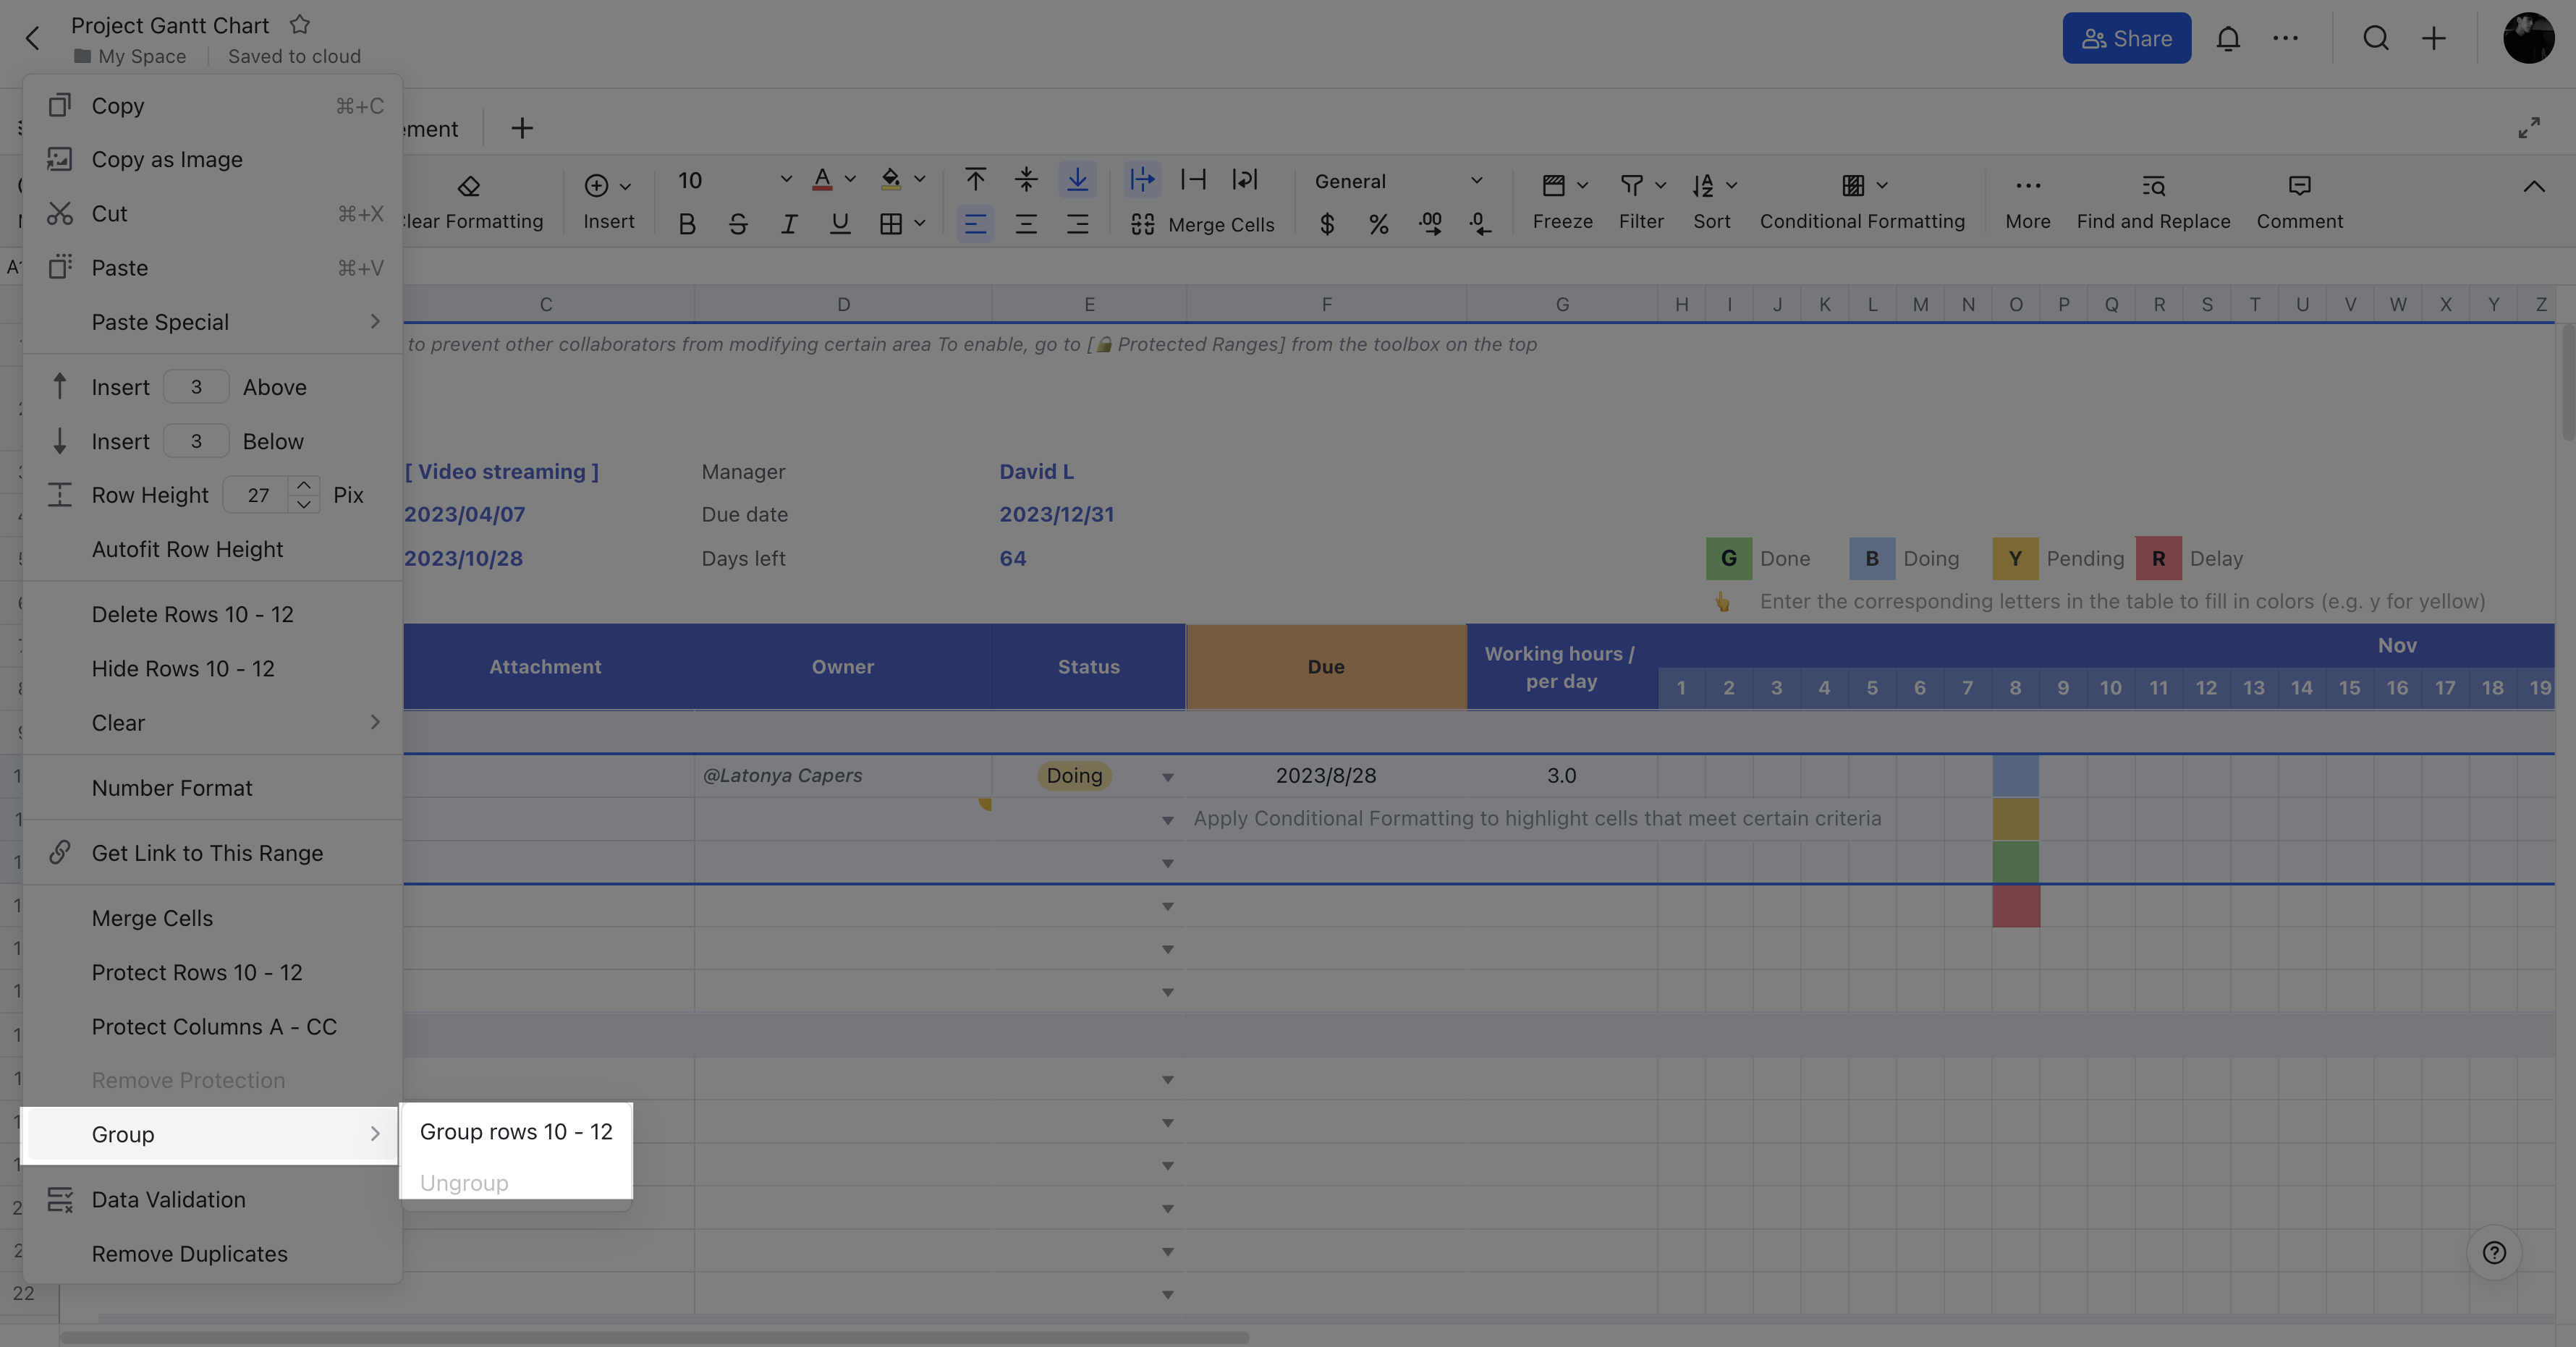
- Group rows and columns: You can collapse/expand grouped rows and columns to improve navigation and present only the data you need. For details, see Group rows and columns in Sheets.
250px|700px|reset
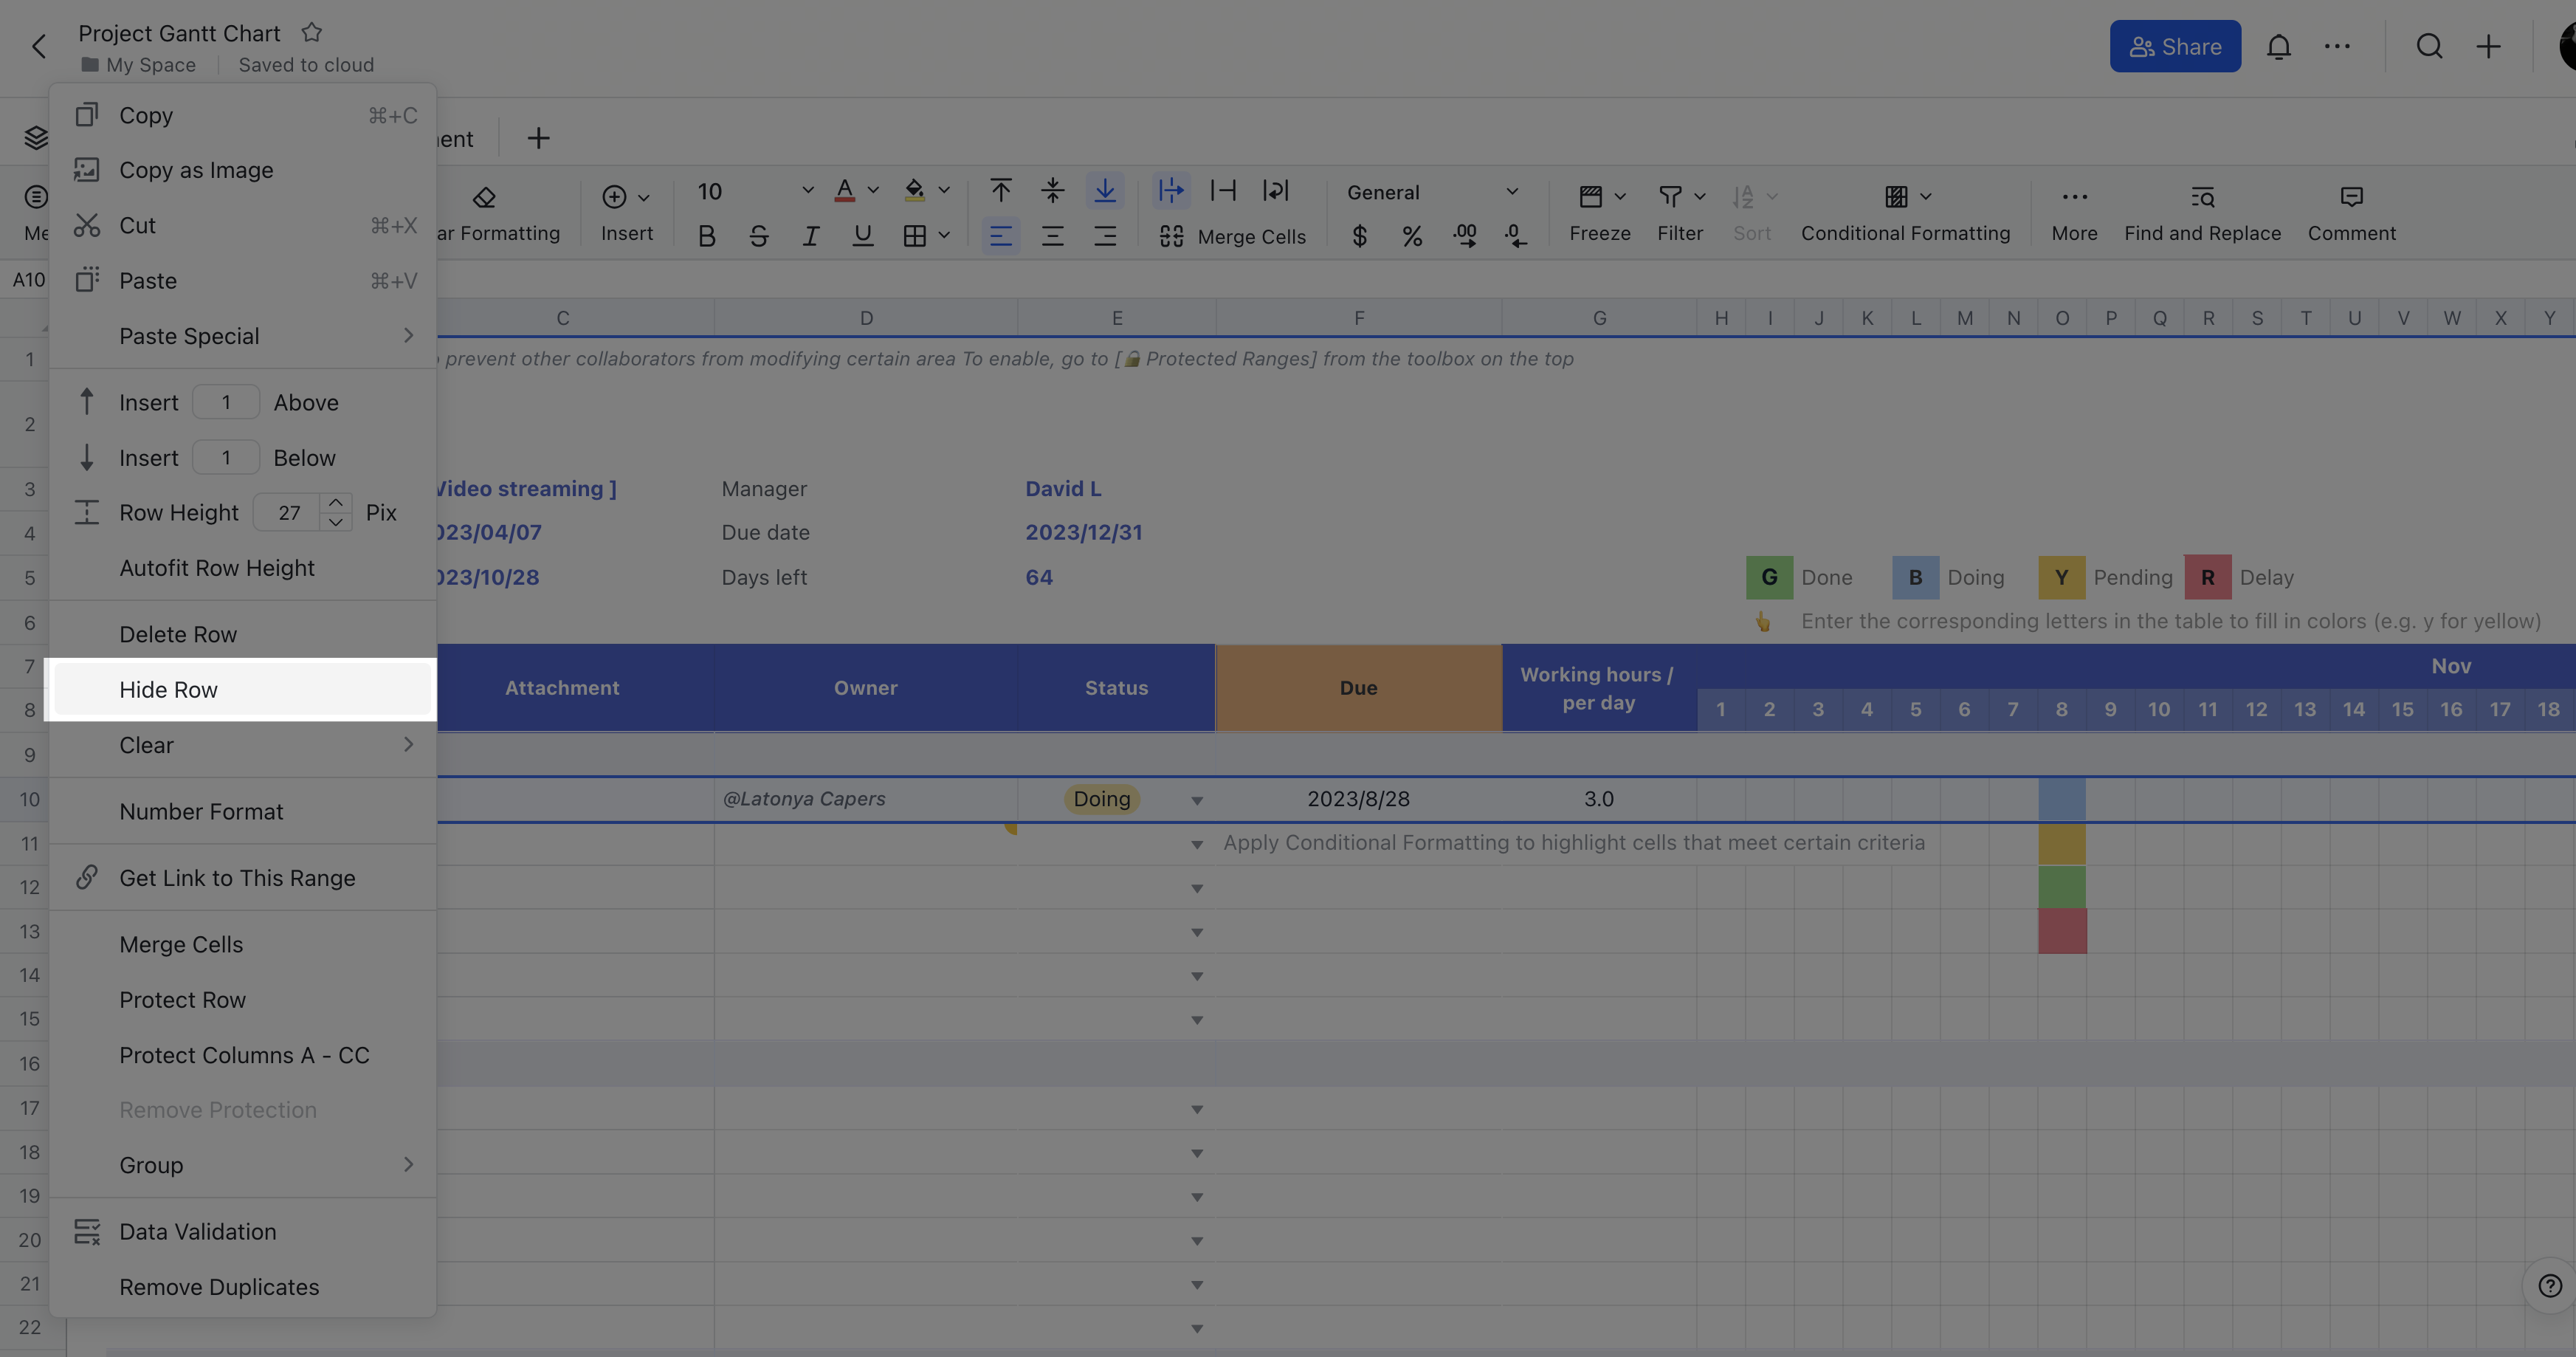
- Hide rows/columns and sheets: Hide information you don't want to present without deleting them, so you can retrieve it any time you need. For details, see Hide sheets, rows, and columns in Sheets.
250px|700px|reset
Step 4: Organize the data
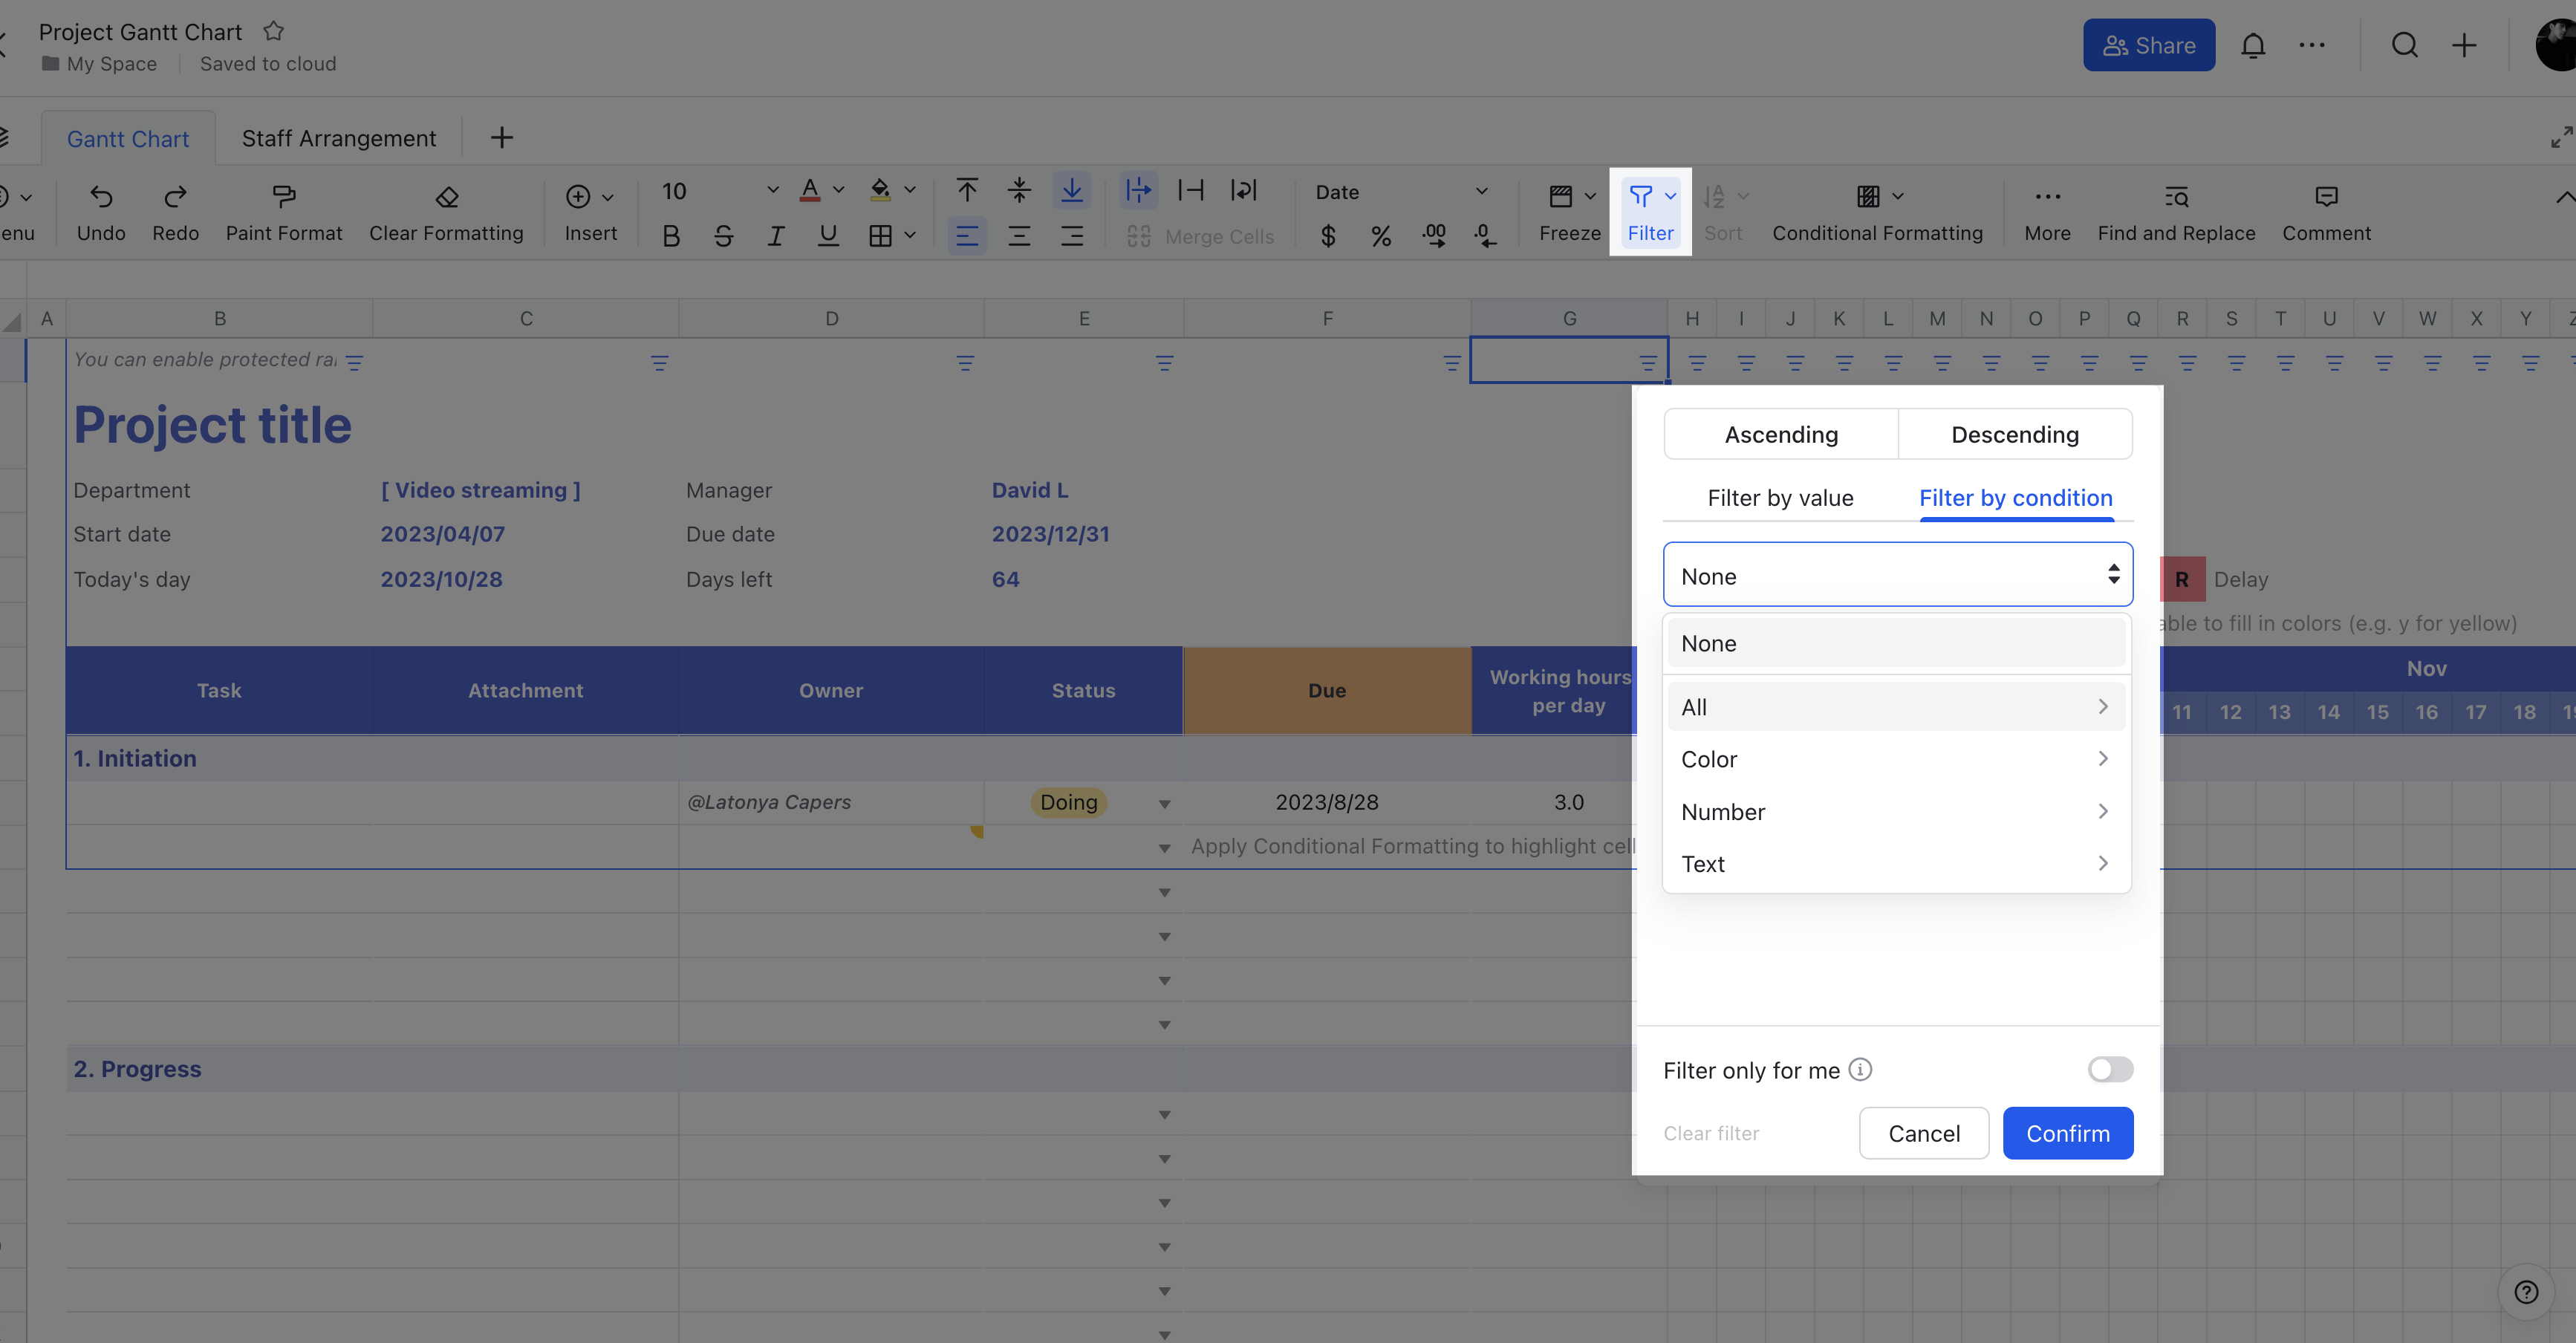
Filter
- Select the data range you want to explore and create a filter for it in the toolbar. You can filter by color, text, number, date, and other conditions to quickly find the data you need. For details, see Filter data in Sheets.
250px|700px|reset
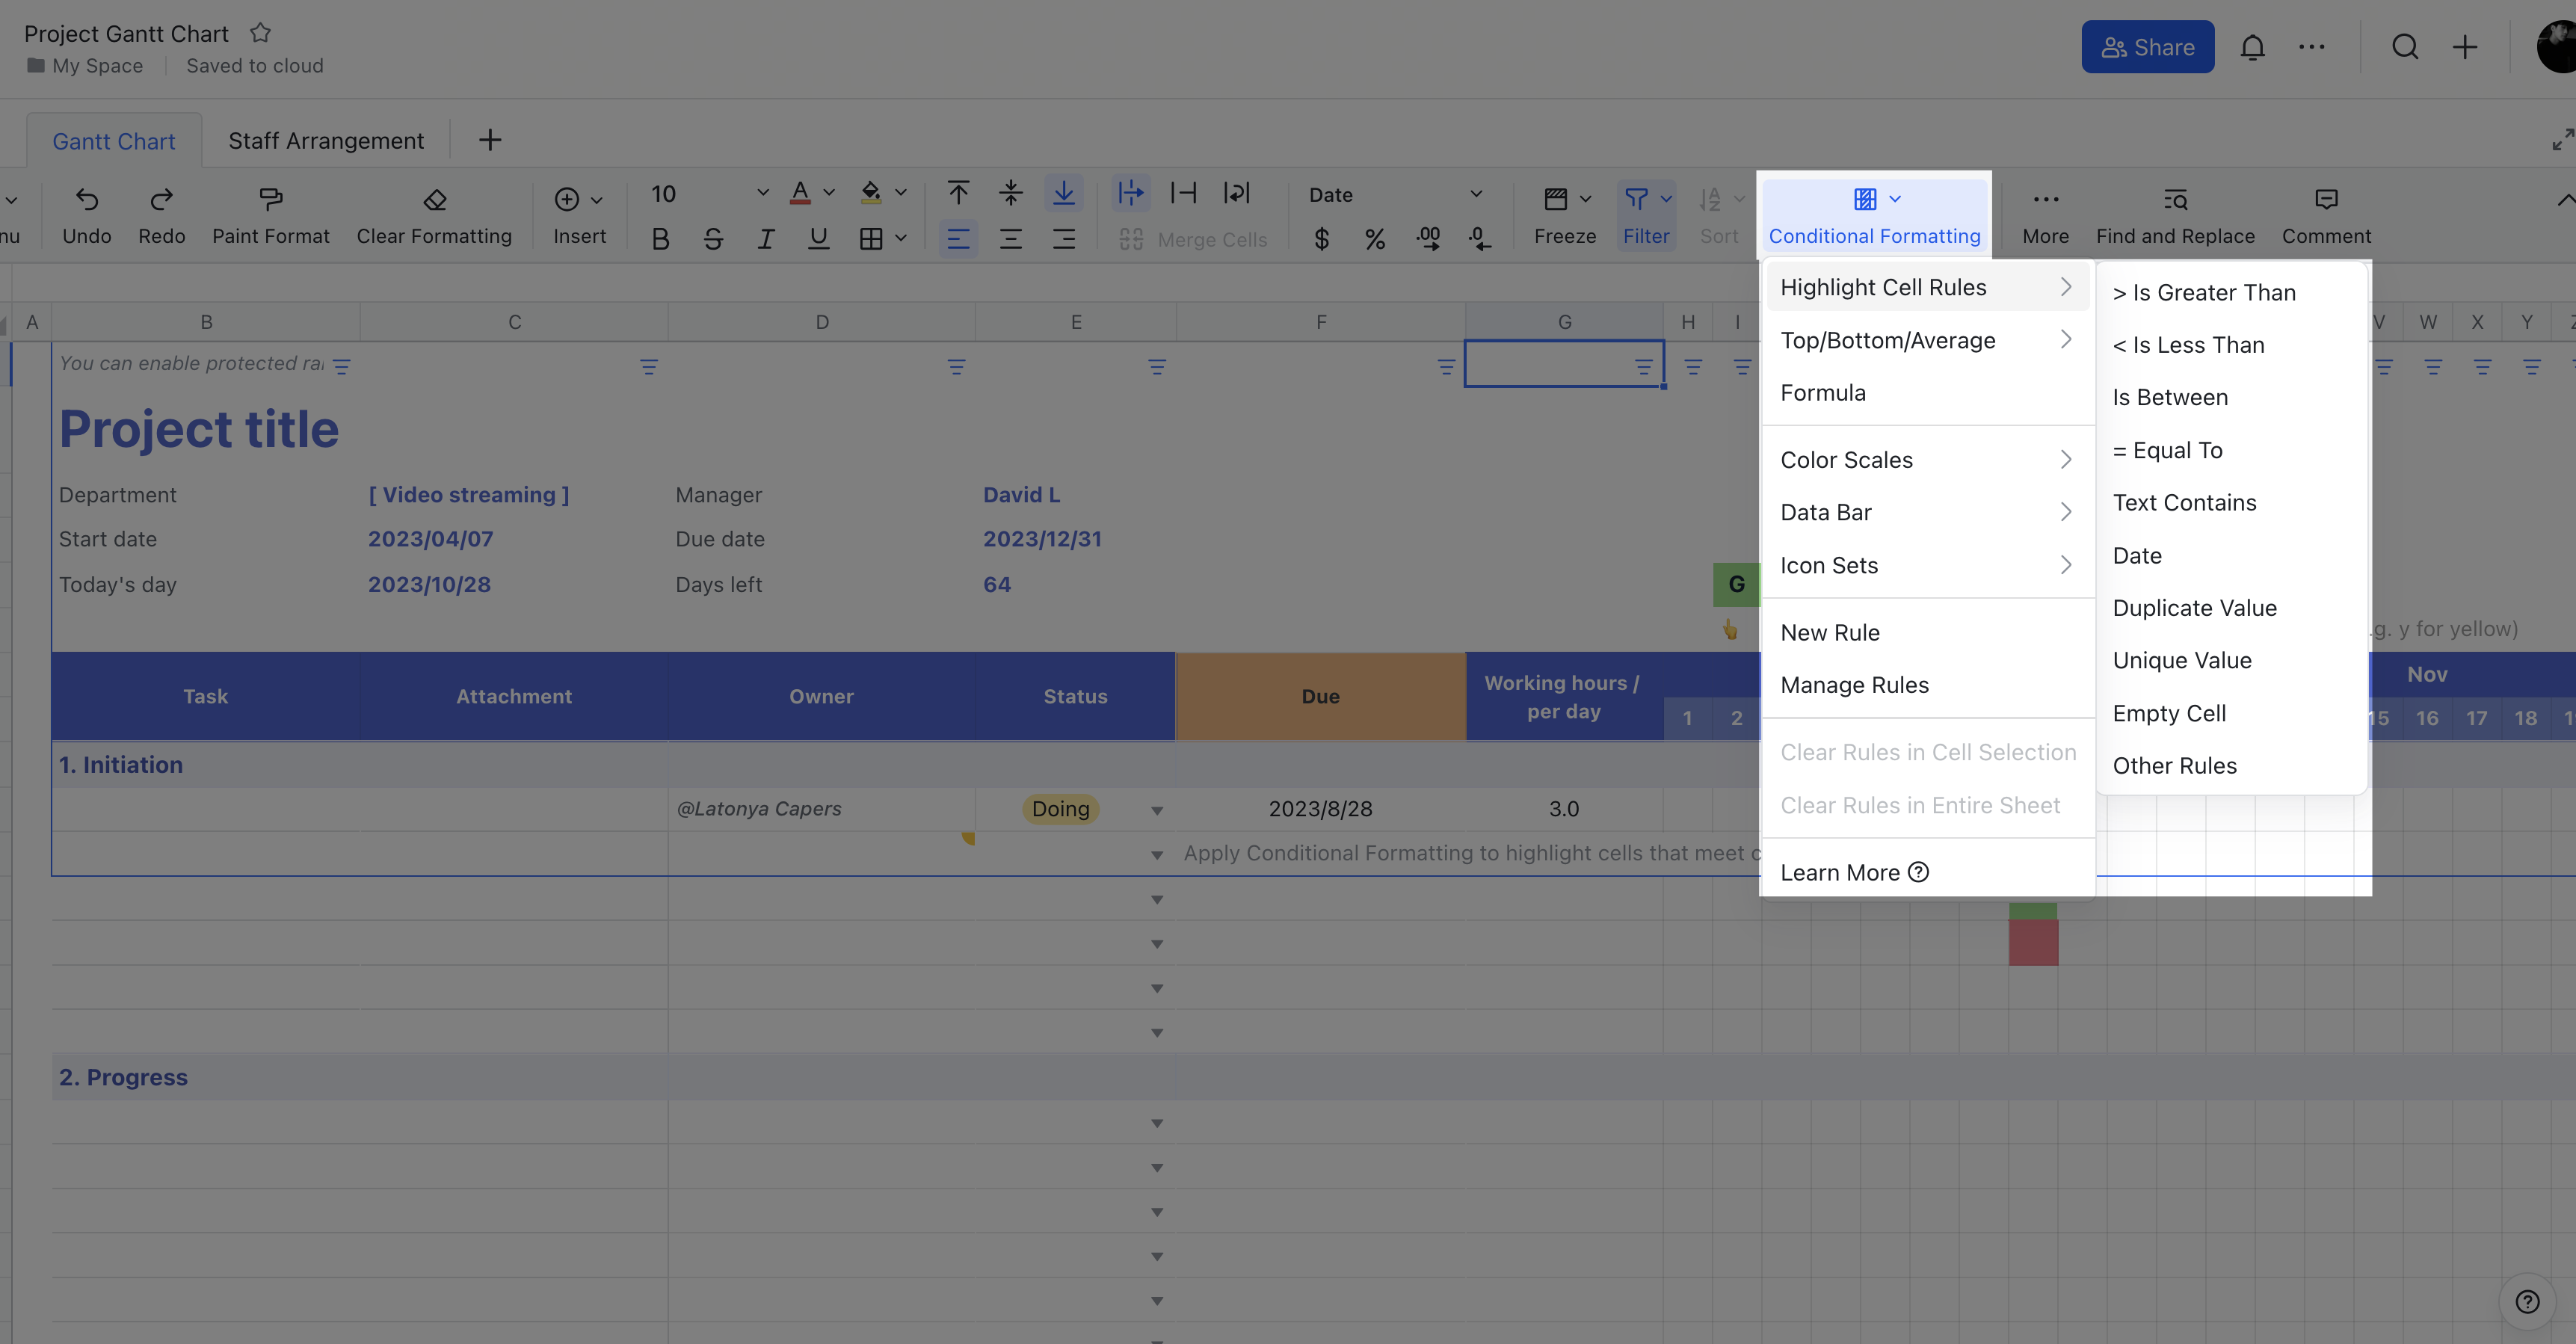
Apply conditional formatting
- Conditional formatting highlights cells that meet specified conditions through colors, icons, and more to help you get an intuitive understanding of the data at a glance. For details, see Use conditional formatting in sheets.
- A range of built-in conditions can be selected, such as duplicate values, unique values, and empty cells. For more complex conditional formatting applications, see Use cases for custom formulas for conditional formatting.
250px|700px|reset
Step 5: Conduct advanced analysis
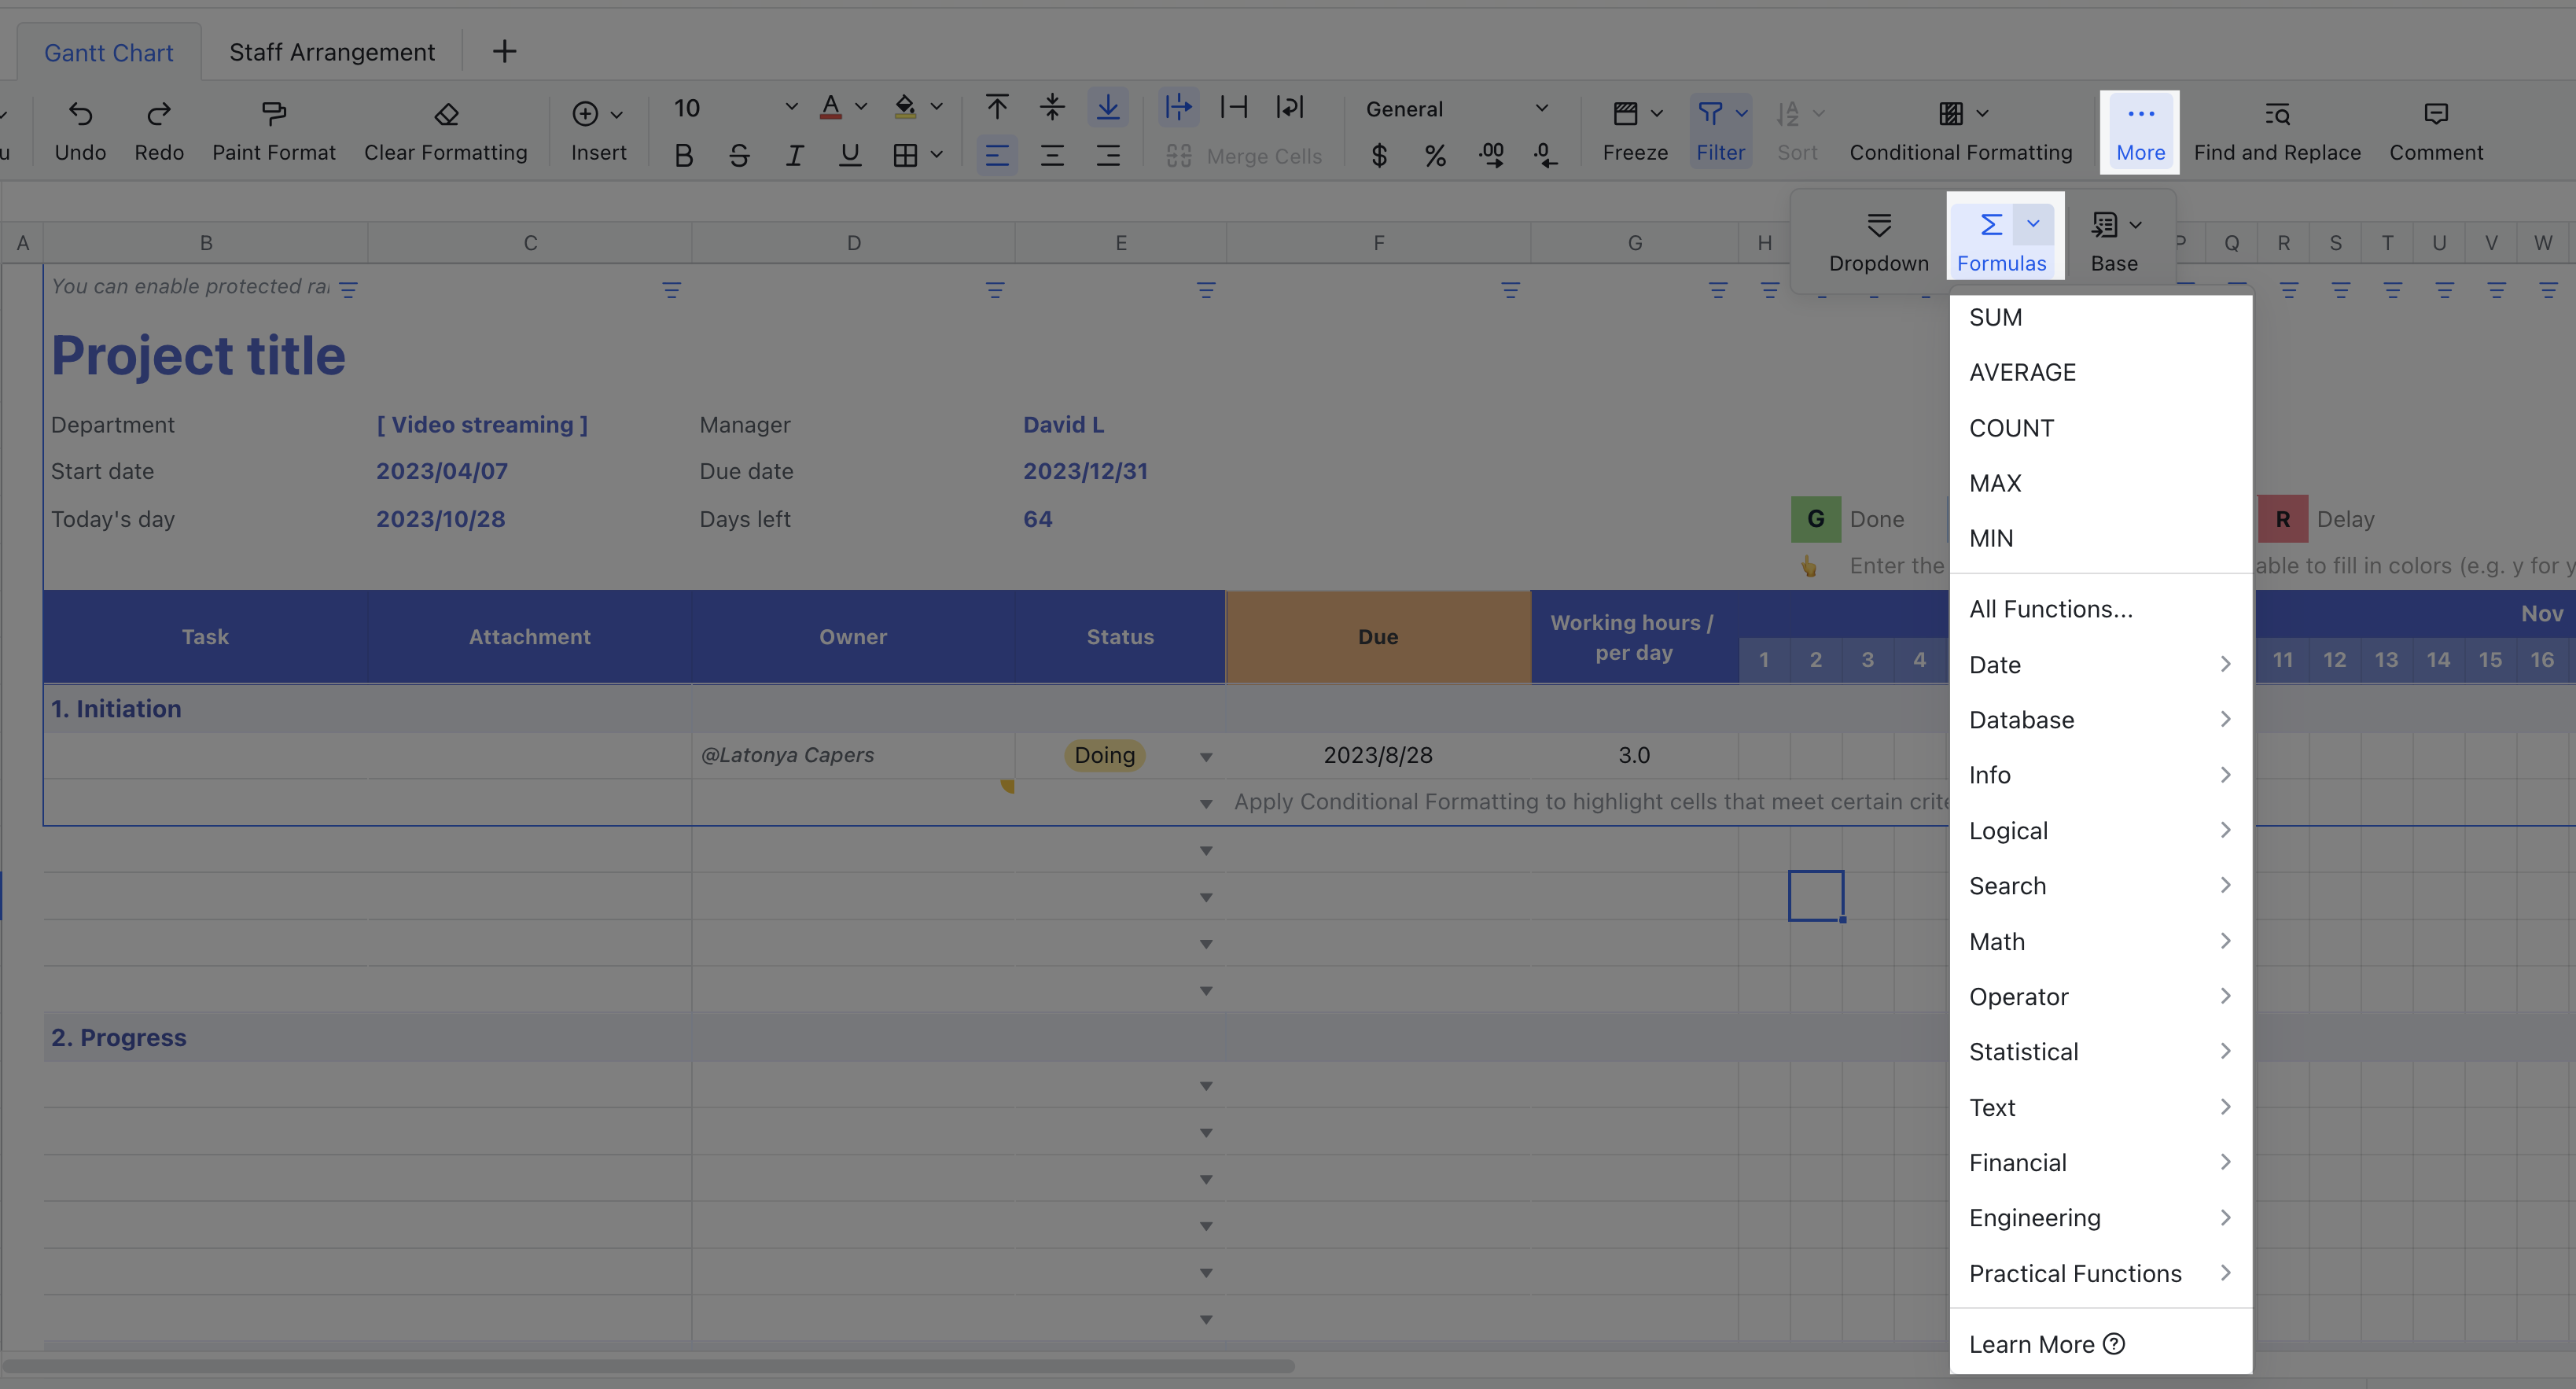
Use formulas
There is a wide variety of formulas available, which can be used for various scenarios such as data cleaning, text processing, statistical analysis, and trend prediction. You simply have to enter the arguments in the formula to get the results. For details, see Use formulas and functions in Sheets.
250px|700px|reset
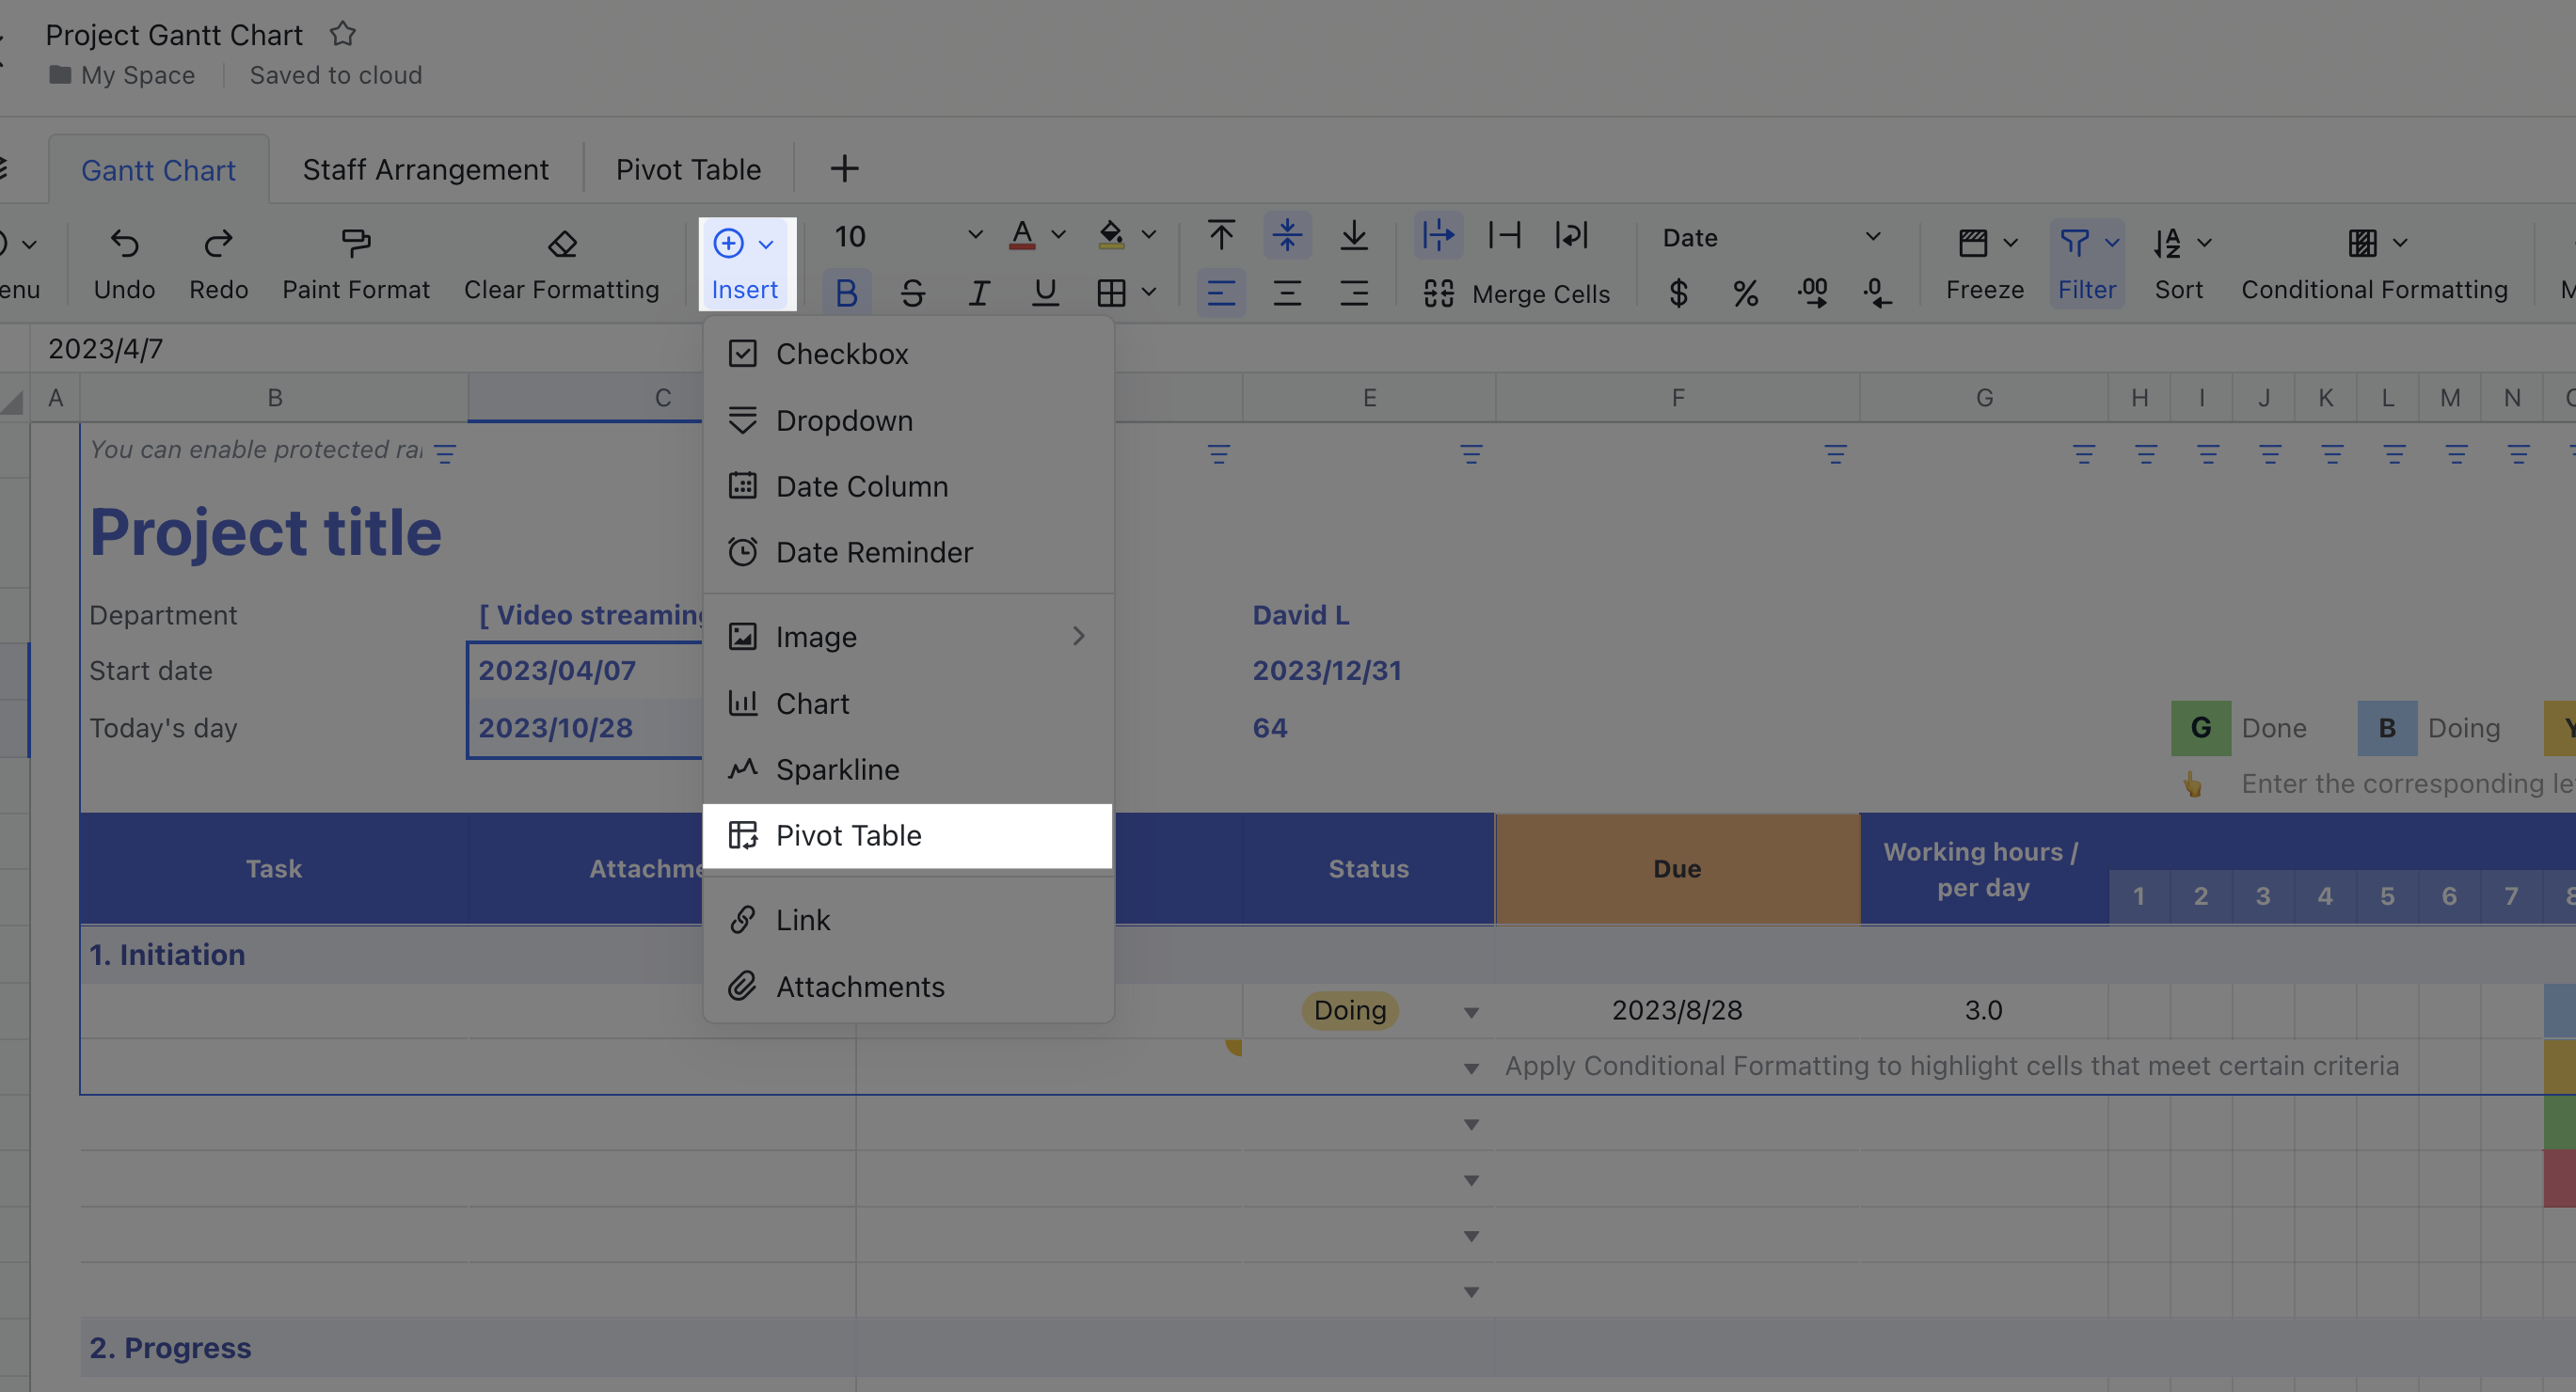
Add a pivot table
When you need to analyze the same data from multiple perspectives, pivot tables can get the job done. Simply drag and drop fields to categorize and summarize complex data and extract key insights. For details, see Create and use pivot tables.
250px|700px|reset
Step 6: Visualize data with charts
- Want to show what the numbers mean or spot any hidden trends? Convert the data into charts and graphs to use visualization to help tell your story. There is a whole array of charts to choose from, including column, pie, radar, bar, combo, word clouds, and more. For details, see Create and edit charts in Sheets.
250px|700px|reset
- When you need to use charts in documents, you won't have to resort to using screenshots anymore. Simply copy and paste the chart into a Lark document and the chart will remain synced to the source spreadsheet. Any updates from the source spreadsheet or the document will be automatically synced both ways in real time. For more details, see Paste Sheets charts into a document.
IV. Next steps
Want to keep exploring all things Sheets? Check out some of these links:
- To learn more about Sheets, visit the Sheets section of the help center.
- For questions on Sheets' limits, see Sheet limitations.
- To see the latest feature updates, see Lark Docs updates.