
I. Intro
The RANK.EQ function returns the highest rank of the designated value within the data set.
To use this function, enter =RANK.EQ in a cell, or click Menu > Data > Formulas > Statistical > RANK.EQ in the toolbar. Enter the arguments and press Enter.
II. About the function
- Formula: =RANK.EQ(Value, Data, [Ascending order])
- Arguments:
- Value (required): The value for which you would like to determine the rank.
- Data (required): The data set, that is, the array or reference to be evaluated.
- Ascending order (optional): Whether the "value" in the data set is ranked in ascending or descending order. Enter 0 or omit this for descending order; Enter 1 for ascending order.
- Note: If there are identical values in the data set, they will have the same rank, which will affect the ranking of subsequent values. For example, using RANK.EQ to rank the numbers in the array "1, 2, 3, 3, 4, 5" in descending order, the two 3 values will both have a rank of 3, but 2 will have a rank of 5, and there won't be a rank 4.
III. Use cases
Let's say that an organization is giving incentives to the top three sales reps based on the sales volume.
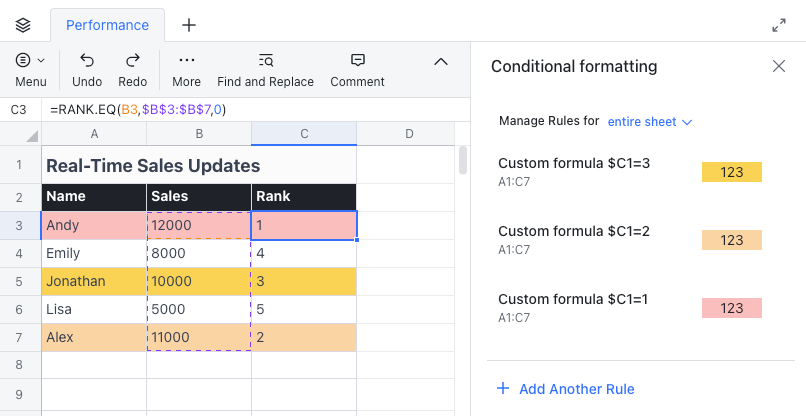
Using RANK.EQ and custom formulas for conditional formatting, you can highlight the top sales reps in the sales performance sheet in real time, and when the sheet is updated, the ranks and color will change accordingly.
250px|700px|reset
- First, in the first cell of the rank column (C3), enter the formula =RANK.EQ(B3,$B$3:$B$7,0). Drag down to fill the column to get the rankings for the sales figures.
- Set 3 custom formulas for conditional formatting for the sales table (A1:C7), so that, when the value in column C is 1, 2, and 3, the corresponding row will be highlighted in red, orange, and yellow. To learn more, see Use cases for custom formulas for conditional formatting.
When sales data is updated, the table will change accordingly:
250px|700px|reset