
I. Intro
In Slides, you can add charts including bar charts, line charts, and pie charts. These charts help you show trends in data during presentations. Moreover, you can make your chart more visually appealing by formatting it. This includes changing its size, color, adding shadow, reflection, and other formatting options.
II. Steps
Insert a chart
Click Chart in the upper toolbar of a slide to view all supported charts. Click the one you need to add to the slide. You can also copy and paste charts you've created in Sheets.
Method 1: Create a new chart in Slides
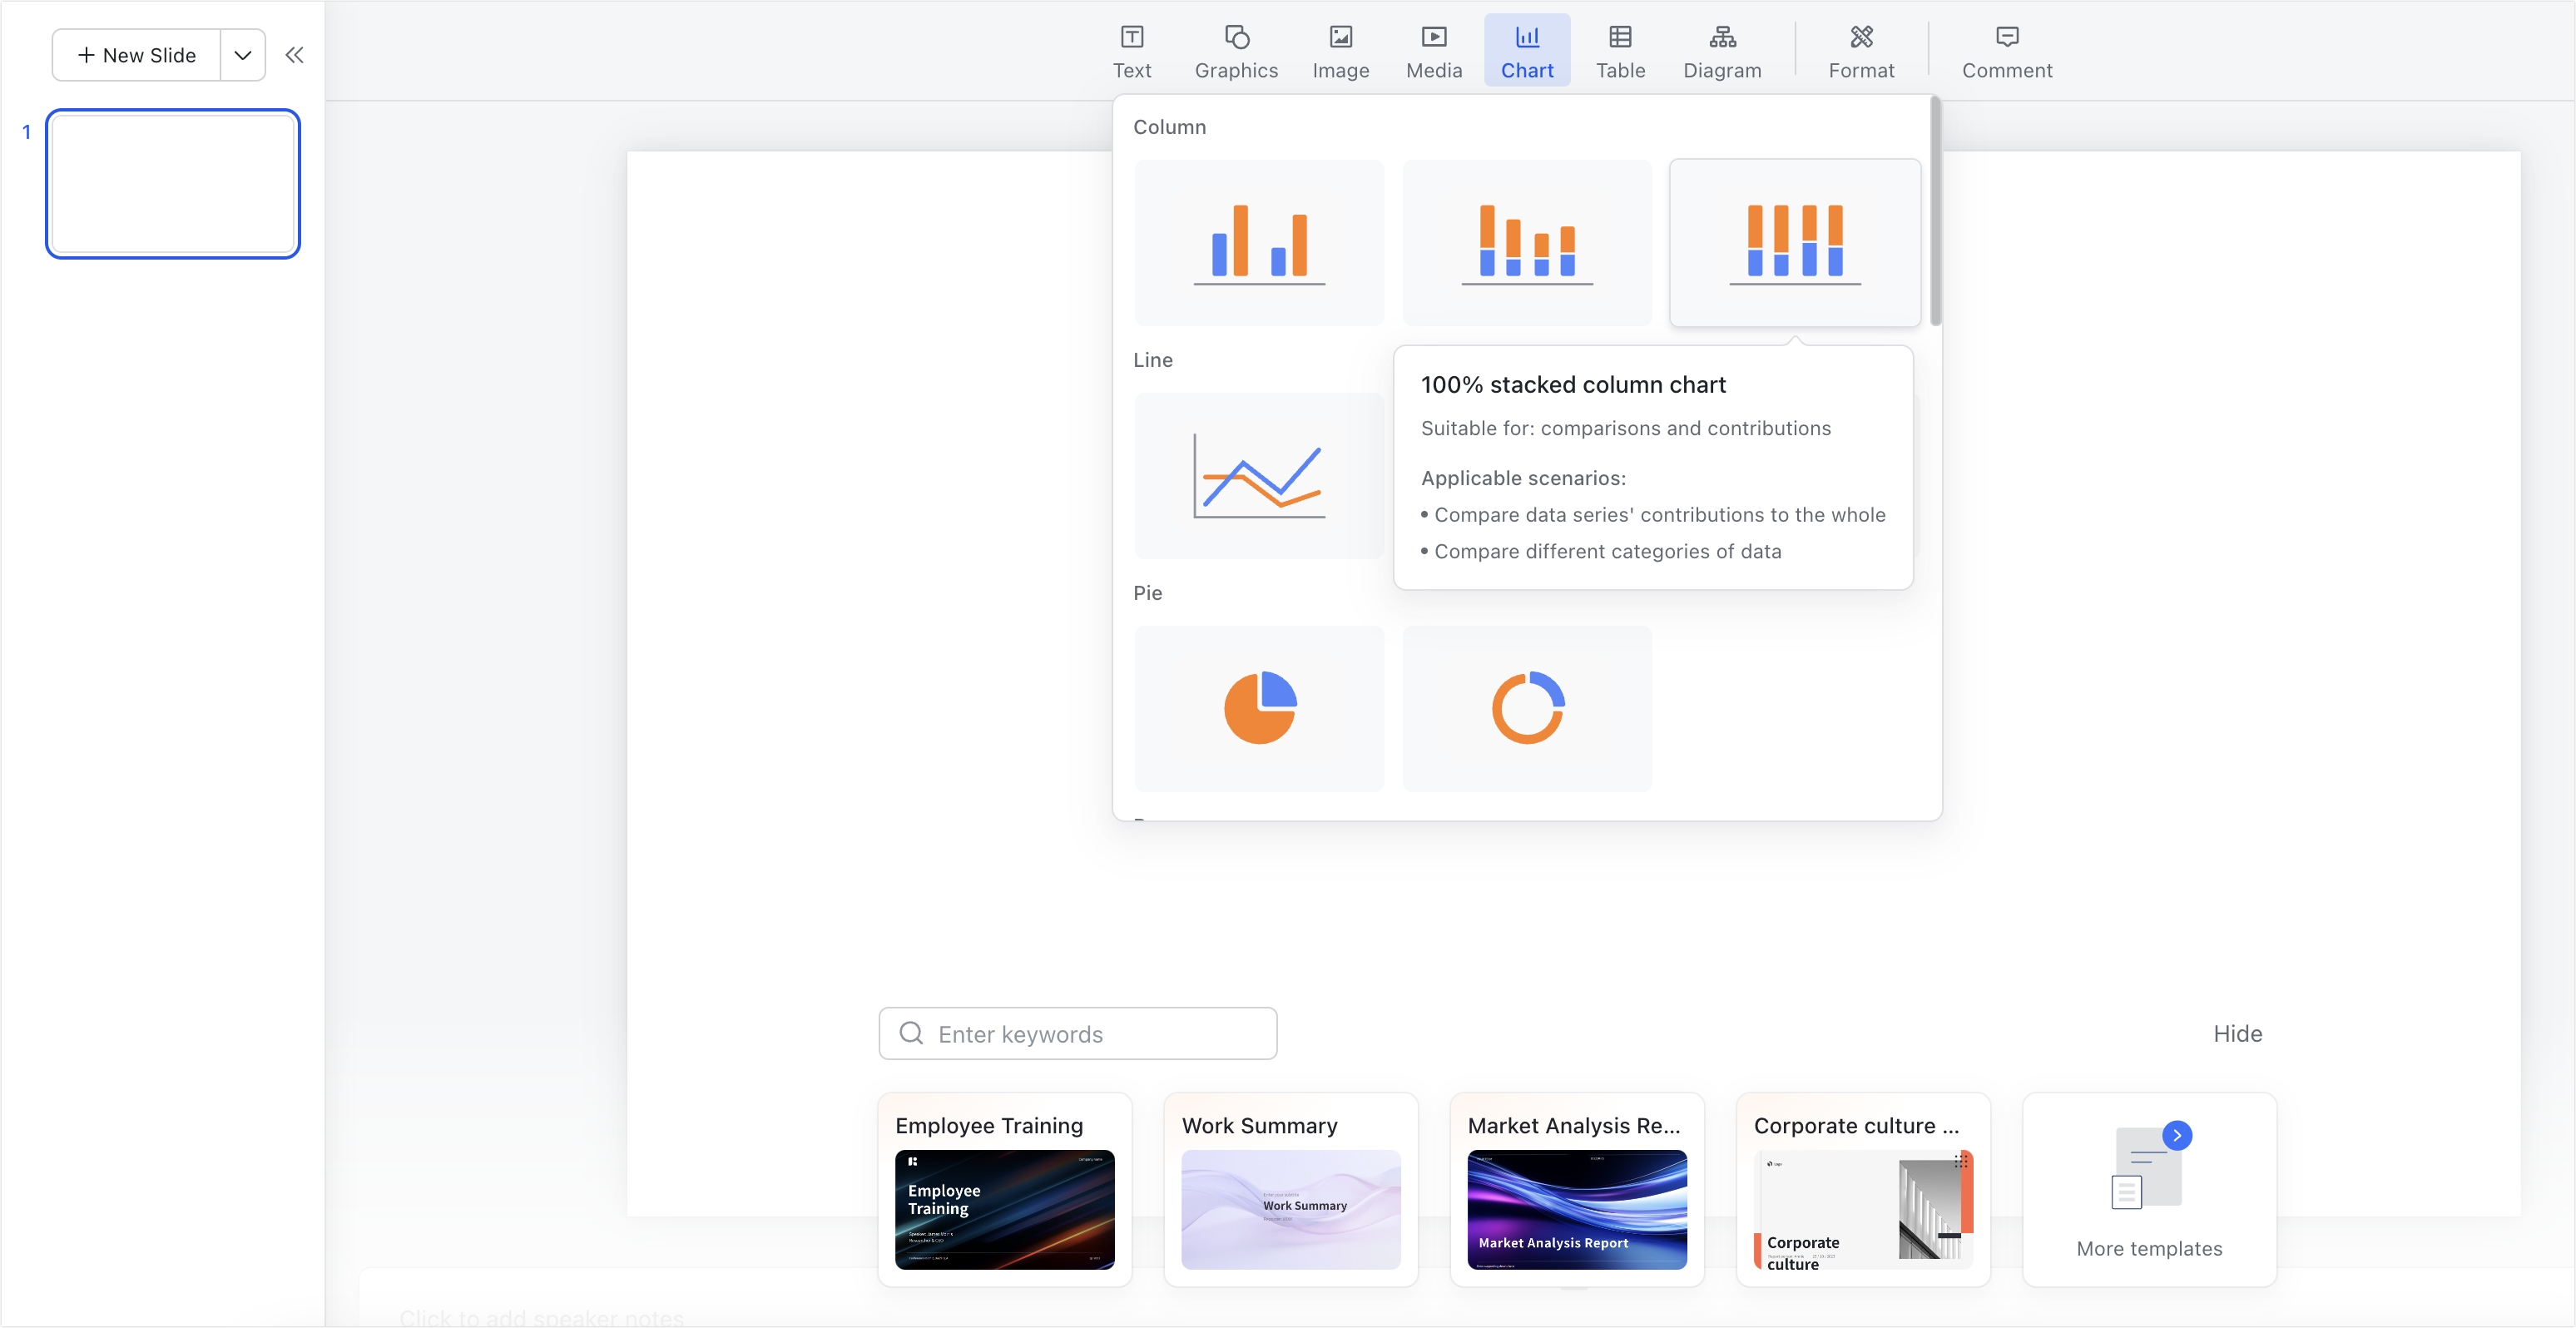
Click Chart in the upper toolbar. Hover over a chart to view what it's suitable for and in which scenarios the chart is ideal. Click a chart to add it to your slide. Lark will then create an associated sheet where you can edit the chart's content.
Notes:
- Permission to view the chart inserted in a slide is aligned with the permission settings of the slide itself. This means that if you have permission to access the slide, you will be able to view the inserted chart.
- Permissions for the source sheet linked to the chart match the default access settings for newly created Lark documents. To learn how to set the default access settings for newly created Lark documents, see Lark Docs permissions overview.
- The storage location for the source sheet linked to the chart matches the default storage location for the slide.
250px|700px|reset
Method 2: Paste the Sheets chart into a slide
You can copy a chart from an existing sheet and paste it into a slide. When you paste the chart, you can select whether to link to the source chart.
- Link to the source chart: Select one of the options to set the viewing permission:
- Collaborators of this document can view: Users need viewing permission for the slide to view the chart.
- 250px|700px|reset
- Only source sheet collaborators can view: Users need viewing permission for the source sheet to view the chart in the slide.
- 250px|700px|reset
- Don't link: The chart will be shown as a static image on the slide. It won't change if you adjust the source chart or sheet. You also cannot edit it.
Modify your chart
Click the chart to bring up the floating toolbar. You can perform the following actions:
- Click the View in Sheets icon to open the source sheet where you can edit the data. To learn more, see Create charts in Sheets.
- Click the Update chart icon if you notice the chart on the slide hasn't synced with changes you've made in the source sheet.
- Click the Unlink icon to unlink the chart on your slide from the source sheet. The chart cannot be edited after you perform this action and it is irreversible.
- Click the Download icon to save an image of the chart to your device.
- Click the Format icon to open a pane on the right side of the slide. Here you can edit the format of the chart including setting its alignment, size, shadow, reflection, and transparency.
- Click the Comment icon to post a comment. For example, you could @mention your colleague to review the chart.
250px|700px|reset