I. Intro
A word cloud is a form of data visualization for text, with words differentiated by color and font size based on frequency defined by the user or auto-segmentation. Word clouds are useful for analyzing text-based data to identify popular terms and visualizing user feedback.
Word clouds are suitable for scenarios where keywords, themes, or key content need to be extracted from a large body of text. For example, in market research, you can use word clouds to analyze what's trending. For user research, you can use word clouds to organize and visualize user feedback.
Note: Text, date, and numerical content are supported.
II. Steps
- Insert a word cloud
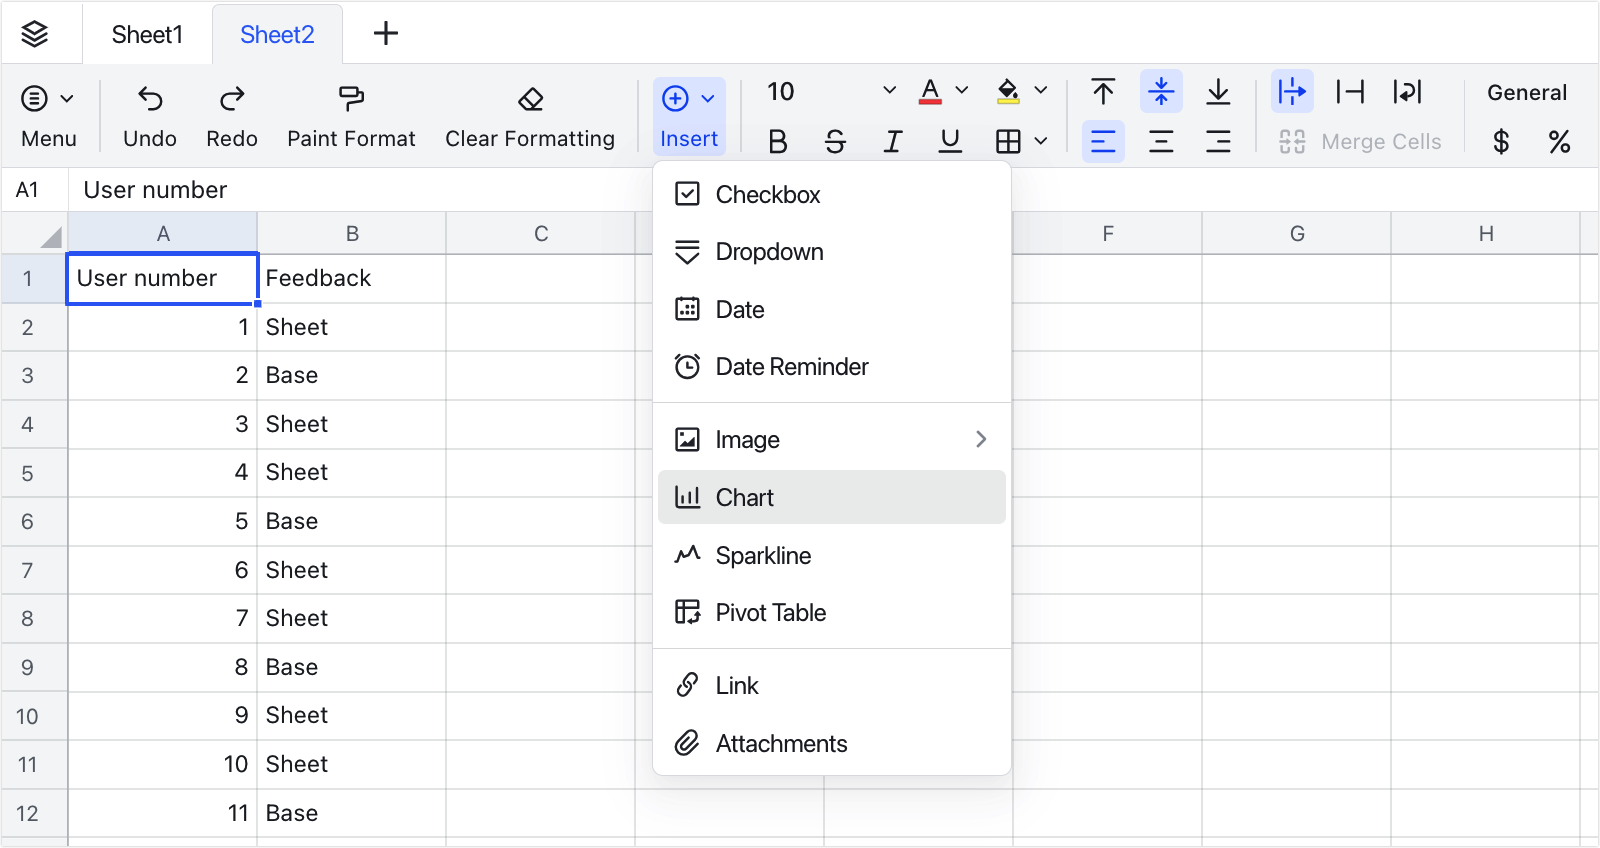
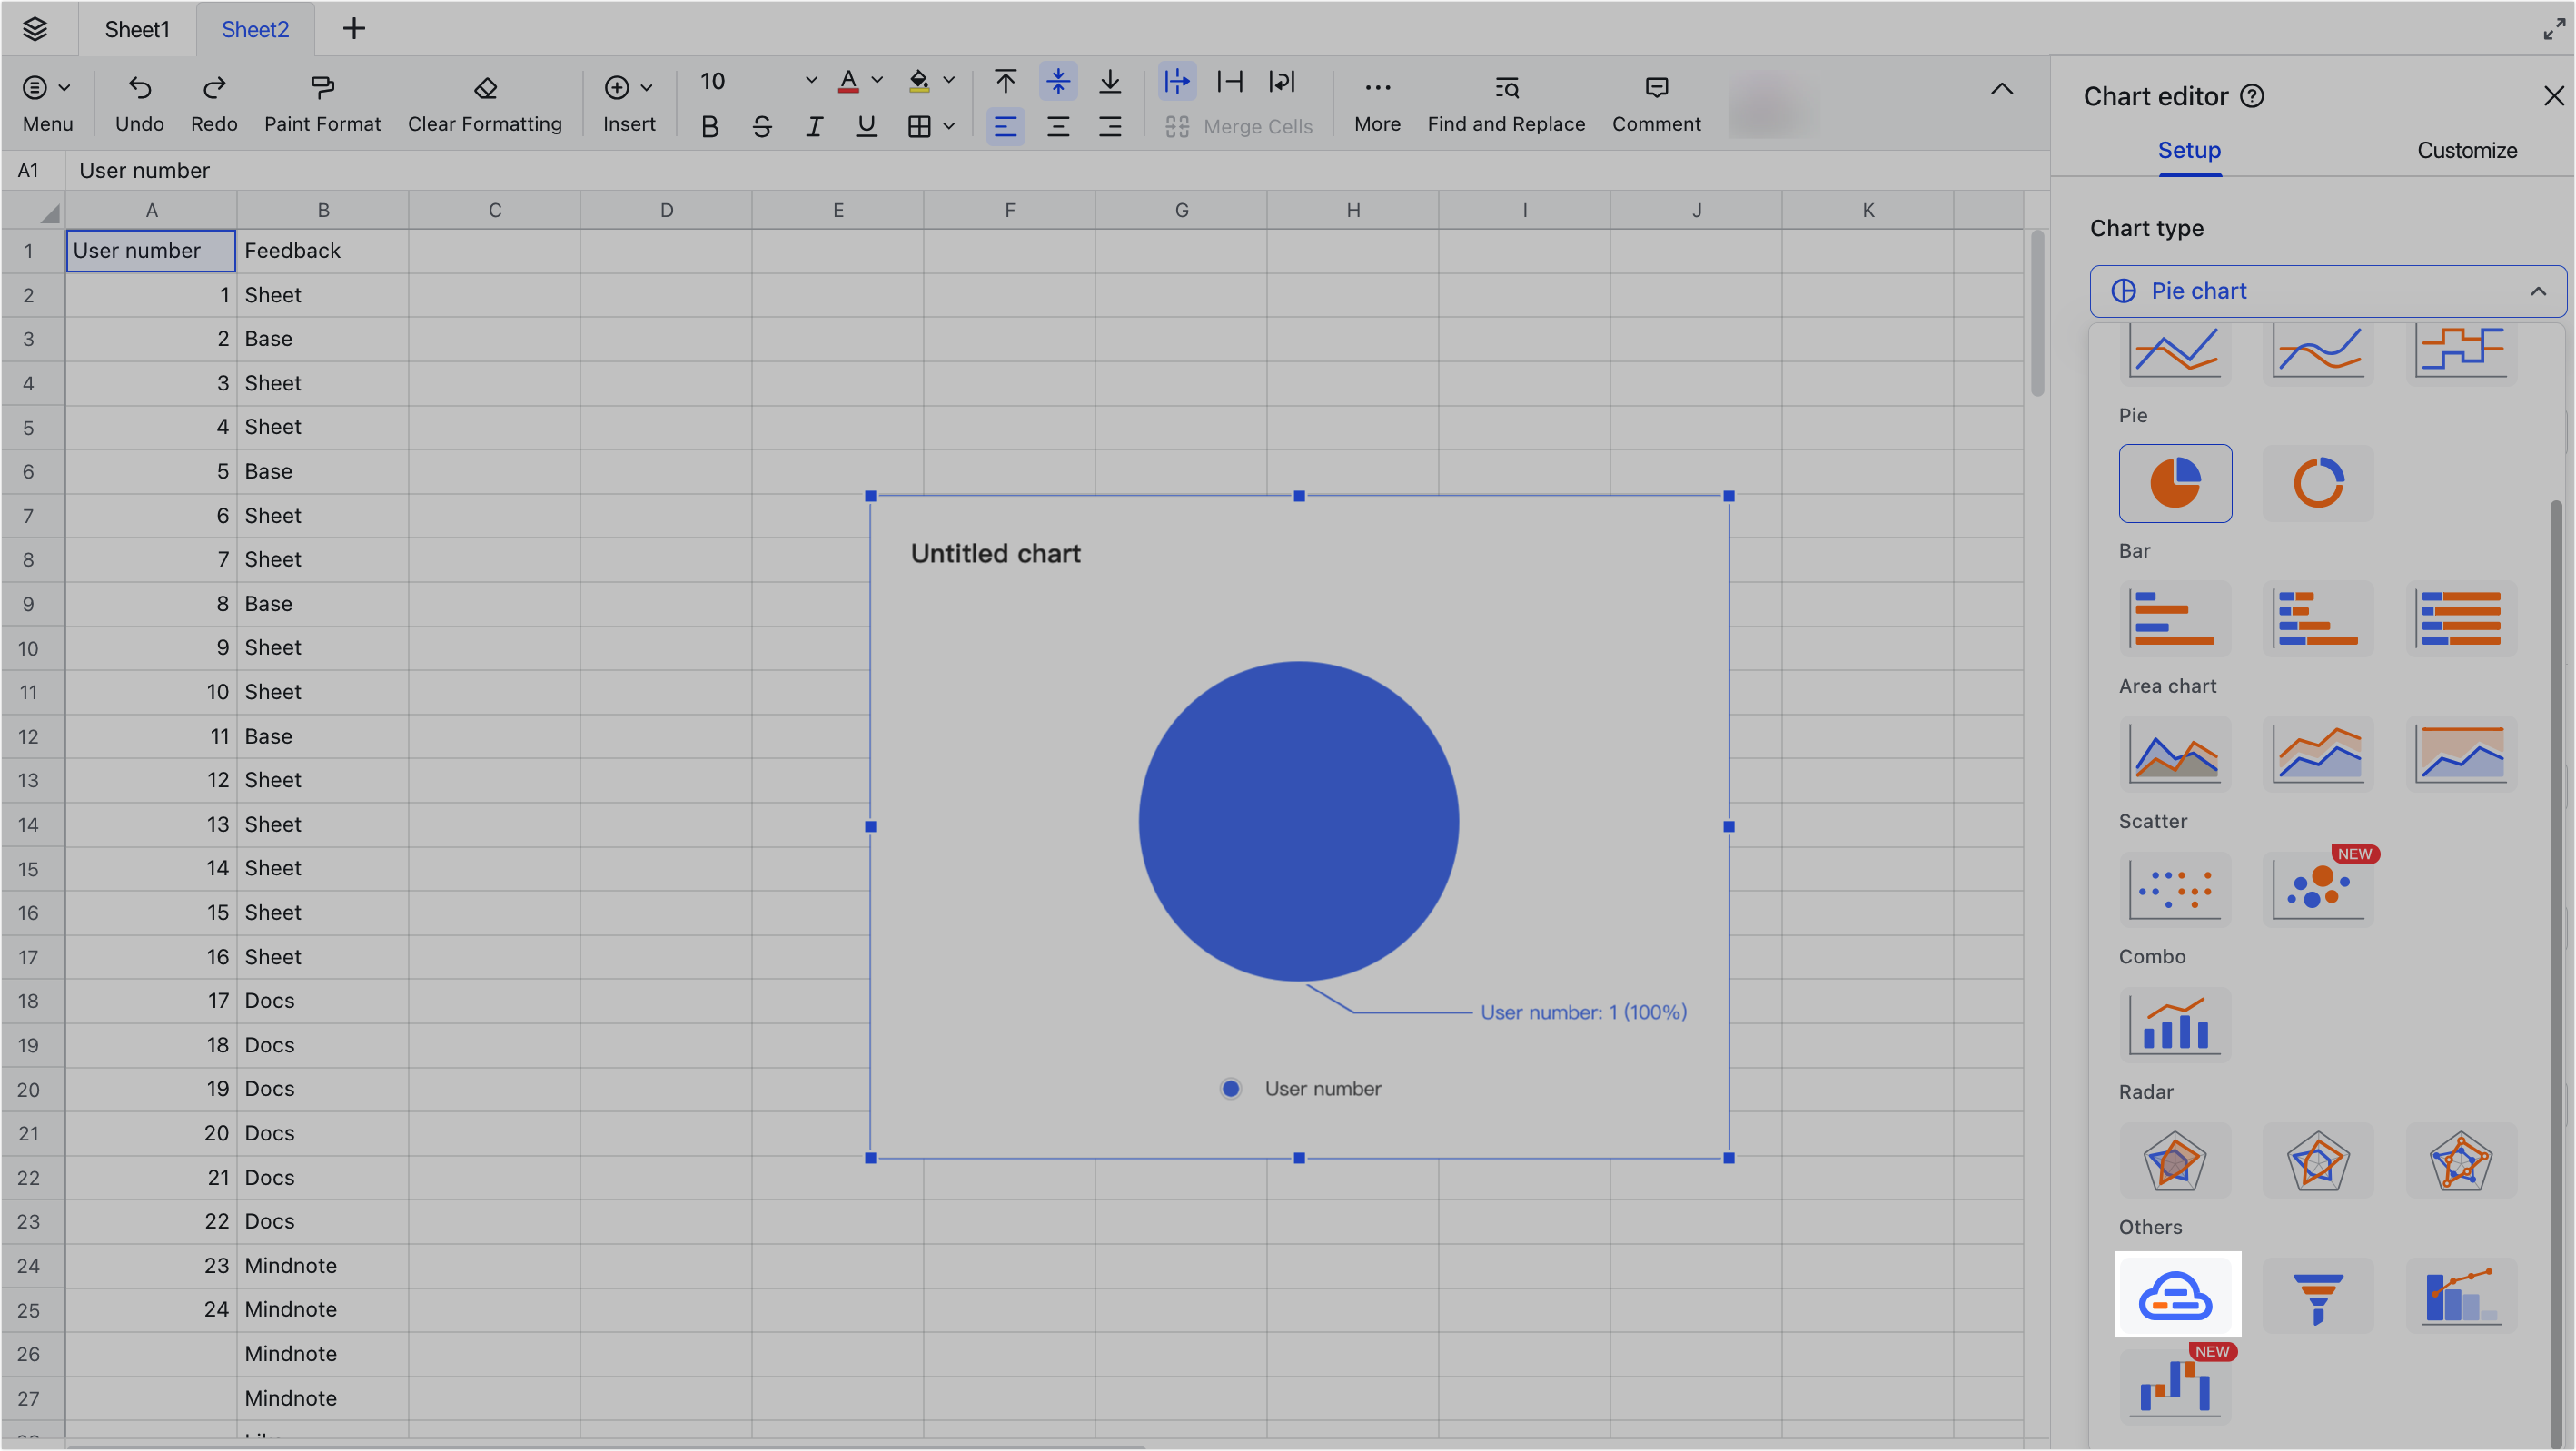
Open Sheets, and click Insert > Chart. On the chart editor on the right, click the field under Chart type, and select the word cloud icon under Others.
250px|700px|reset
250px|700px|reset
- Change shape
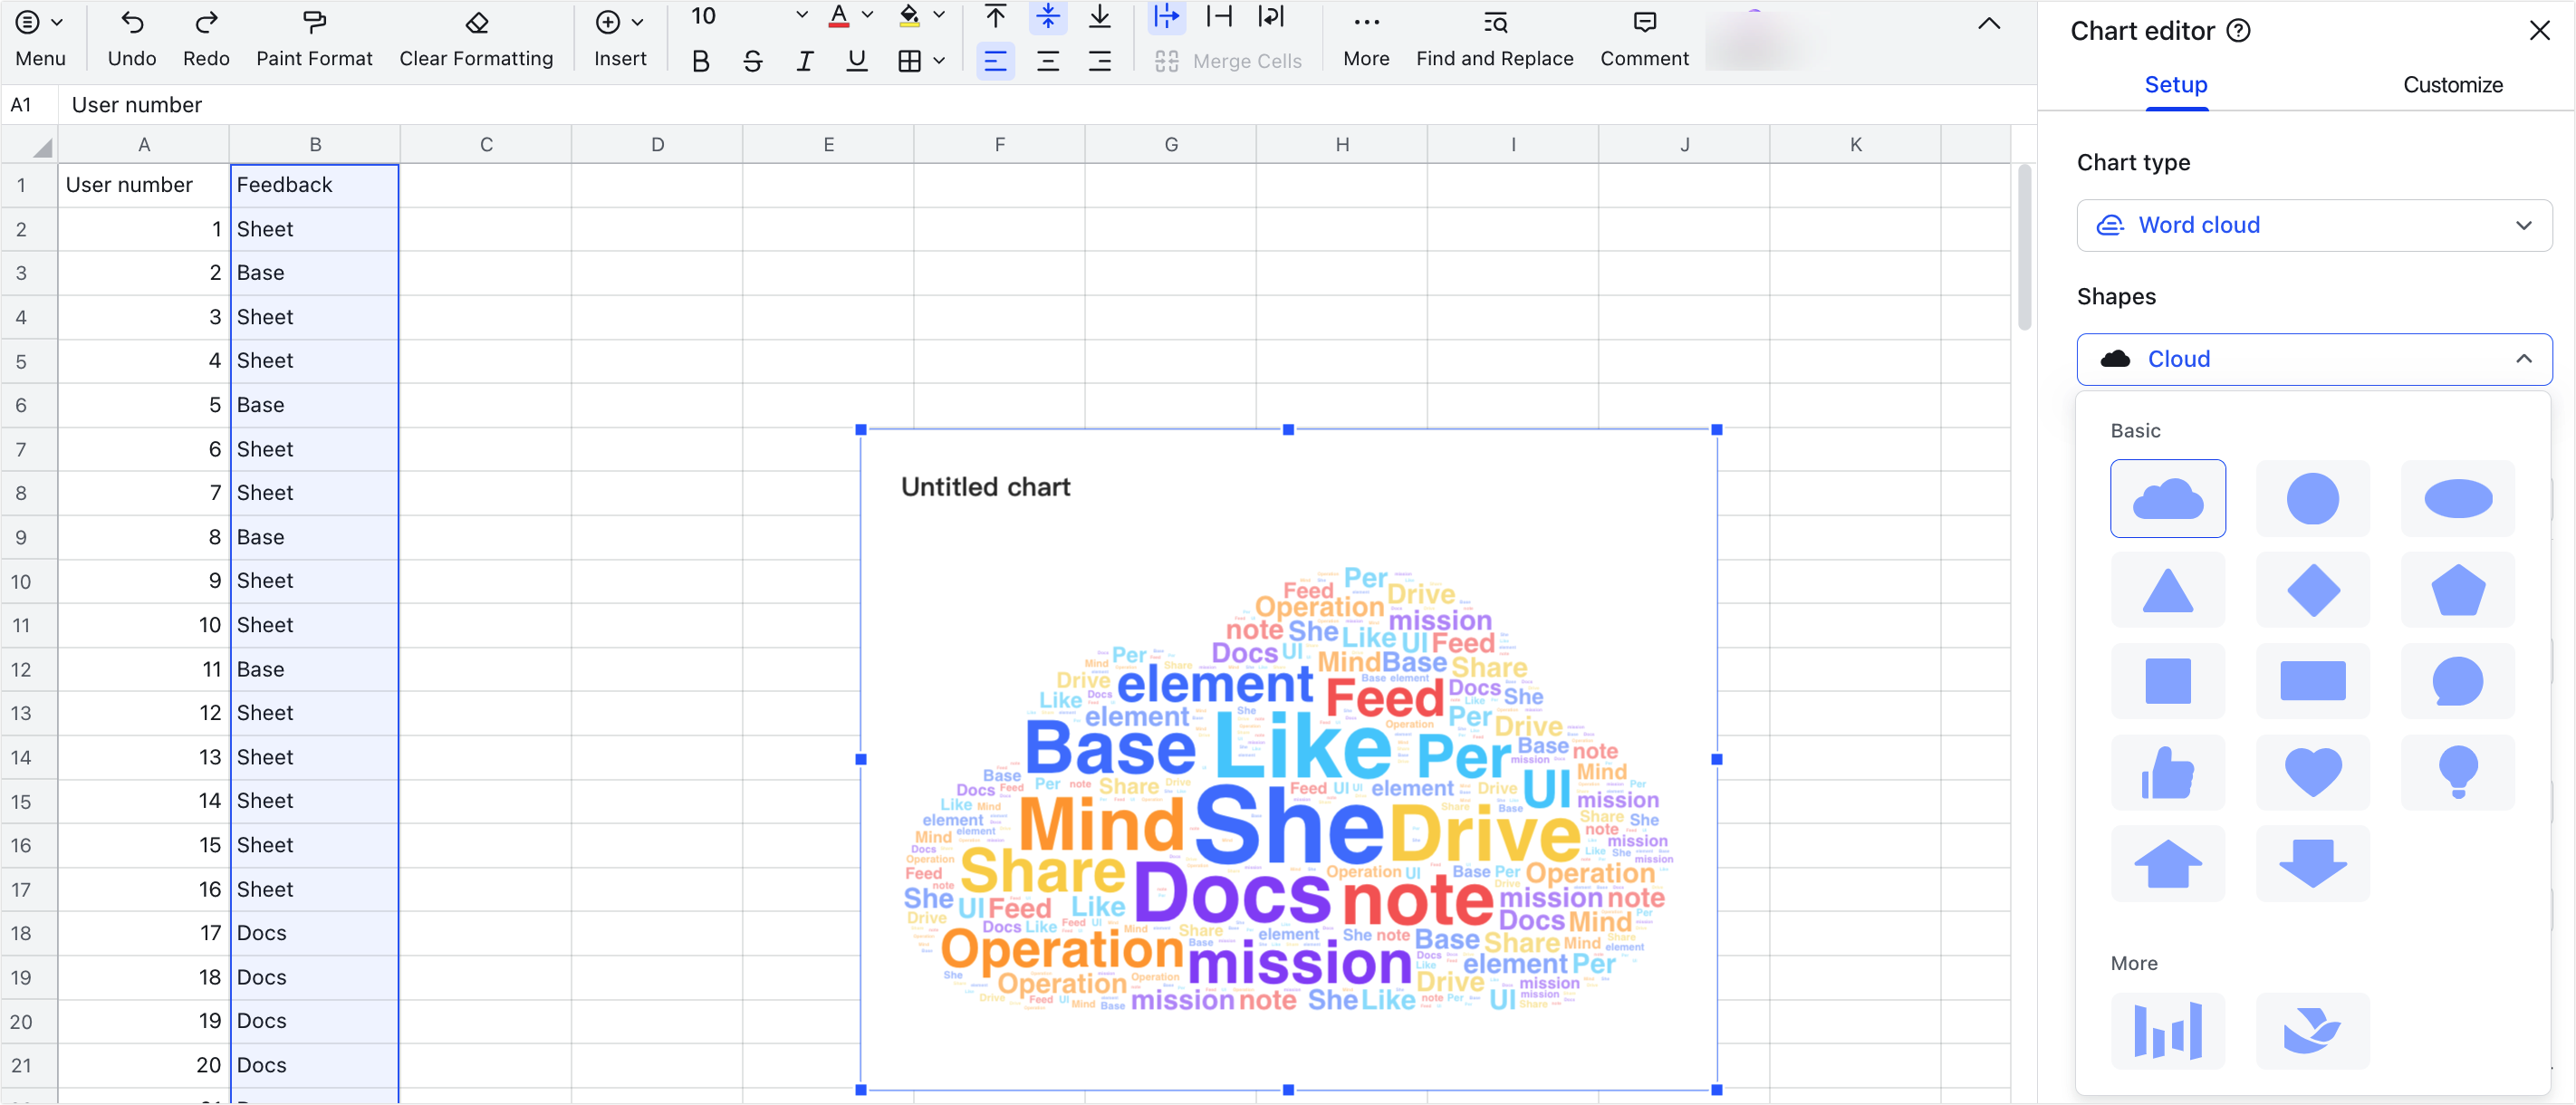
In Setup, click the field under Shapes, and choose a word cloud shape, including cloud, triangle, heart, and more.
250px|700px|reset
- Select a theme
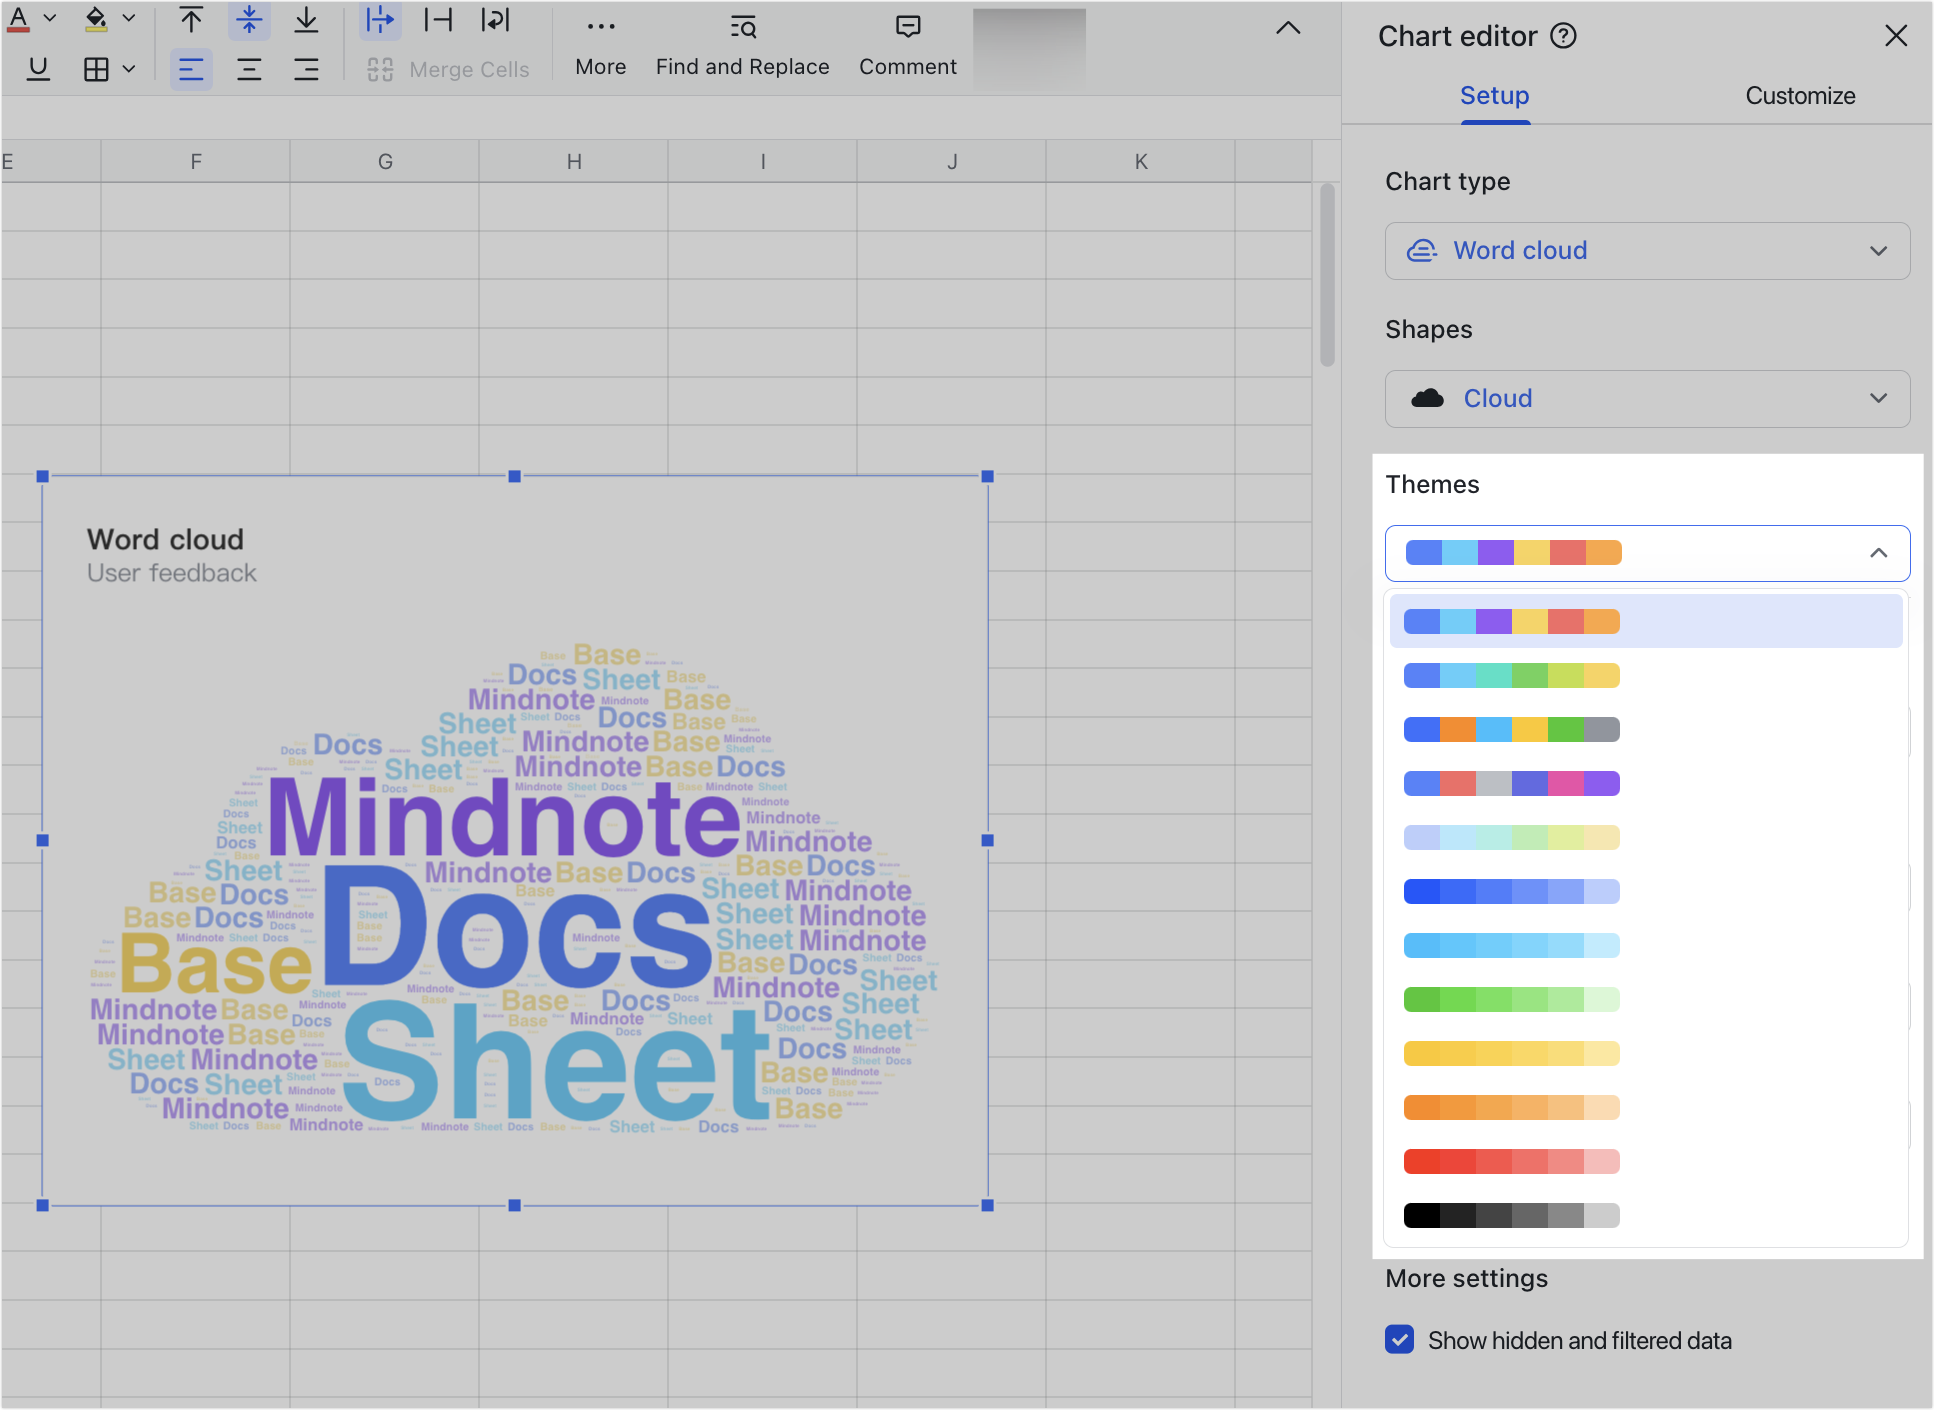
In Setup, click the field under Themes to choose a theme for the word cloud.
250px|700px|reset
- Select a data range
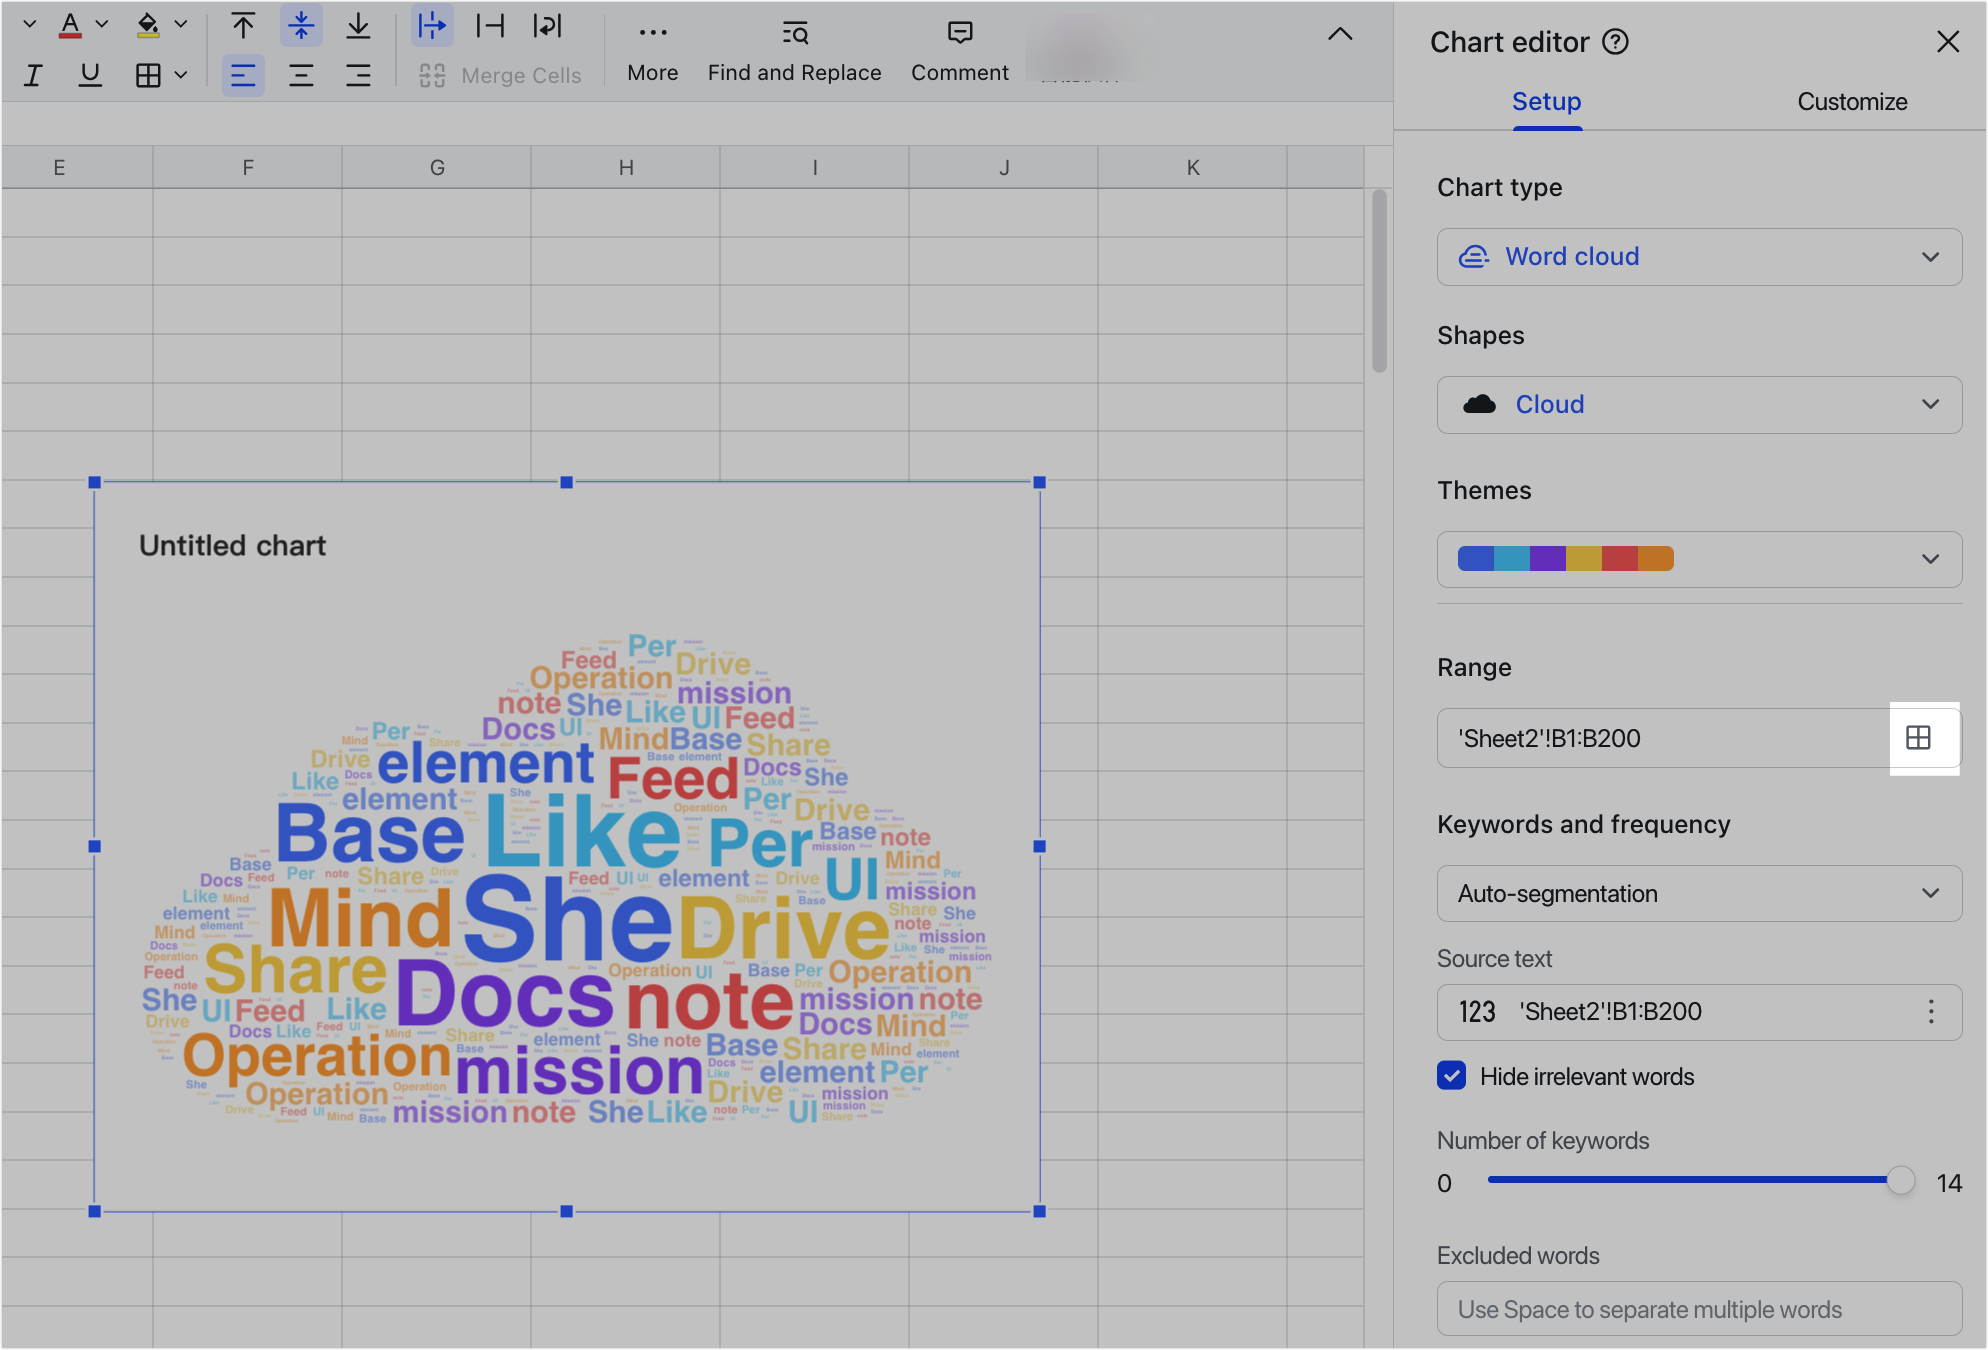
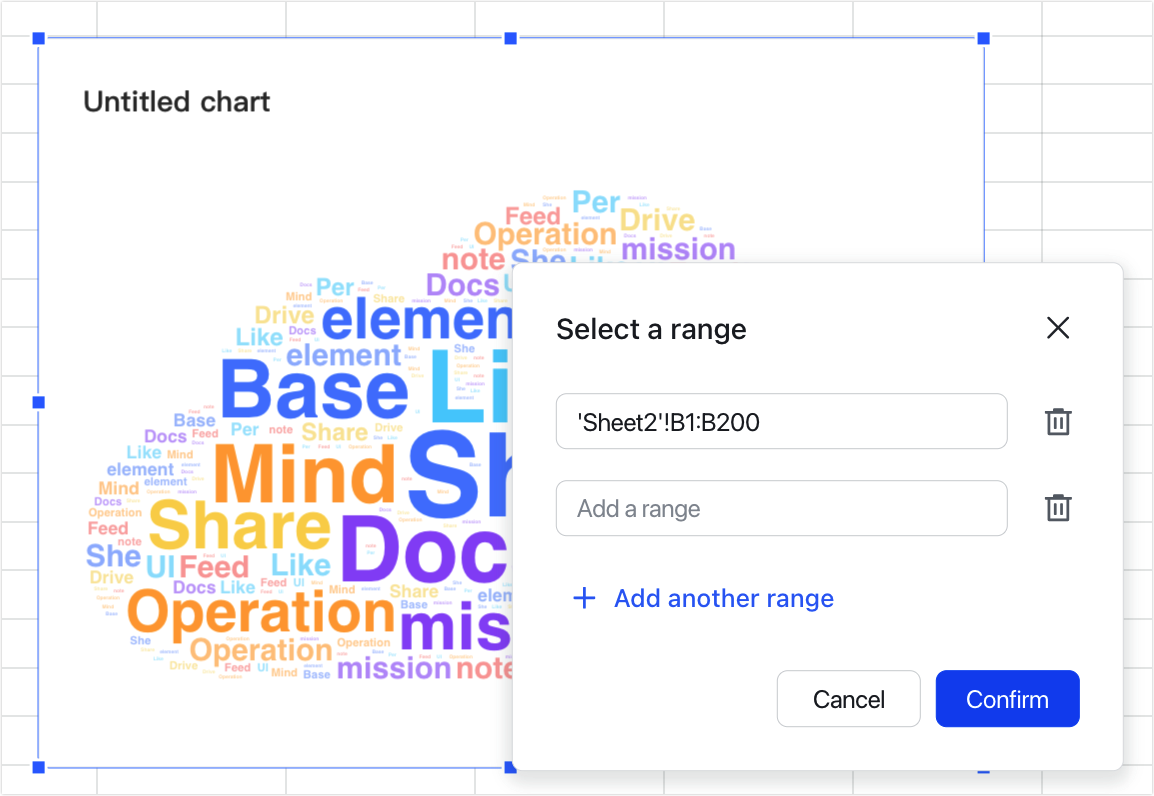
In Setup, click the Grid icon under Range, and select a data range directly in the sheet or enter the range in the pop-up.
Click Add another range to add more data ranges as needed.
250px|700px|reset
250px|700px|reset
- Configure keywords and frequency
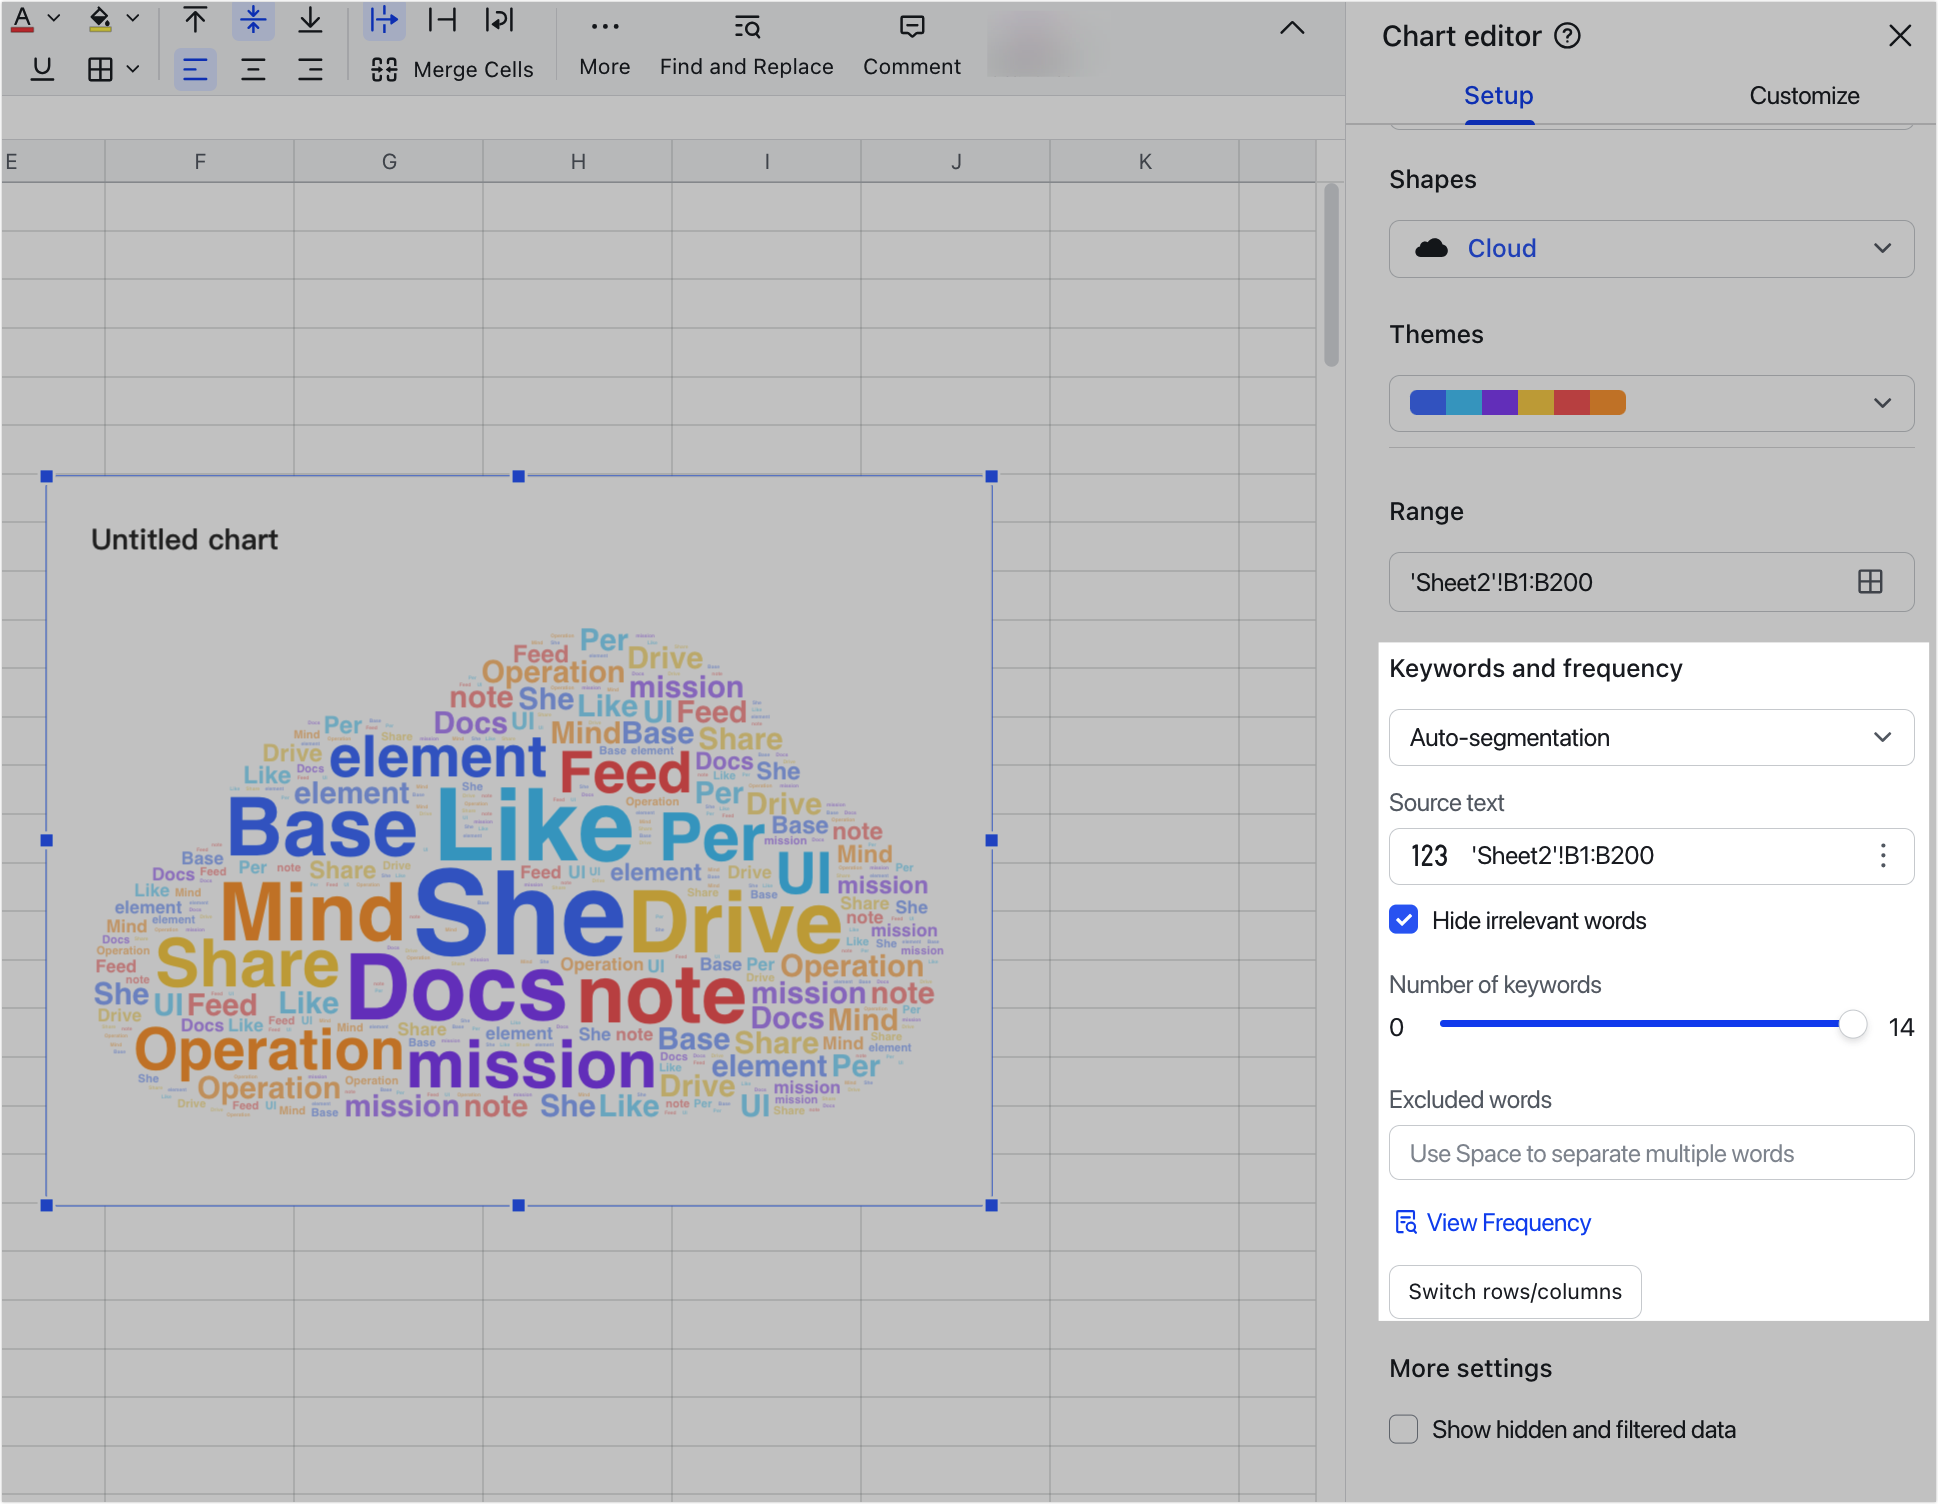
In Setup, you can choose Auto-segmentation or Custom frequency under Keywords and frequency.
Auto-segmentation
The auto-segmentation mode is suitable for quickly creating word clouds, without the need to manually count all the words. Words are automatically segmented and frequency is automatically calculated.
You can filter words in the word cloud, set the maximum number of words, exclude words, view the words and frequency identified in the frequency table, and change the data range by switching rows/columns.
Note:
- Auto-segmentation mode supports displaying content in text, date, and number format.
- In the Excluded words field, separate words with a space.
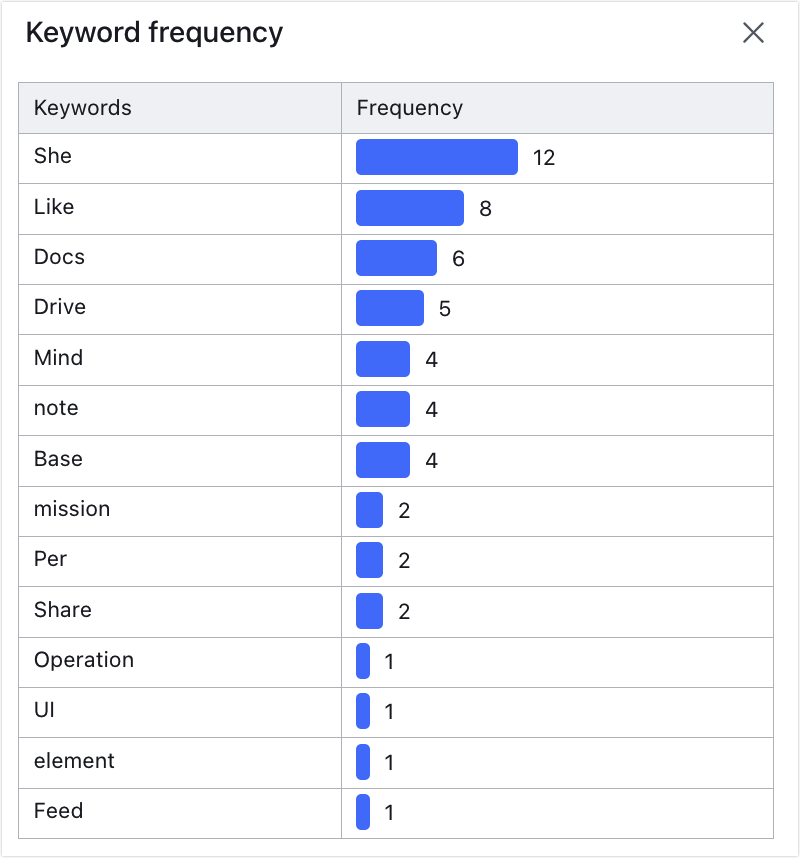
250px|700px|reset
250px|700px|reset
In auto-segmentation mode, the selected data range needs to be in the same row or column. If multiple rows or columns of data are selected as the data range, a Source text option will appear in the Chart editor pane. Click the field under Source text to select a single row or single column of data to be used in the word cloud.
Click Switch rows/columns to autofit the data used by the word cloud according to the data range you selected. This means if you are currently using row data, column data will be used instead when you click Switch rows/columns, and vice versa.
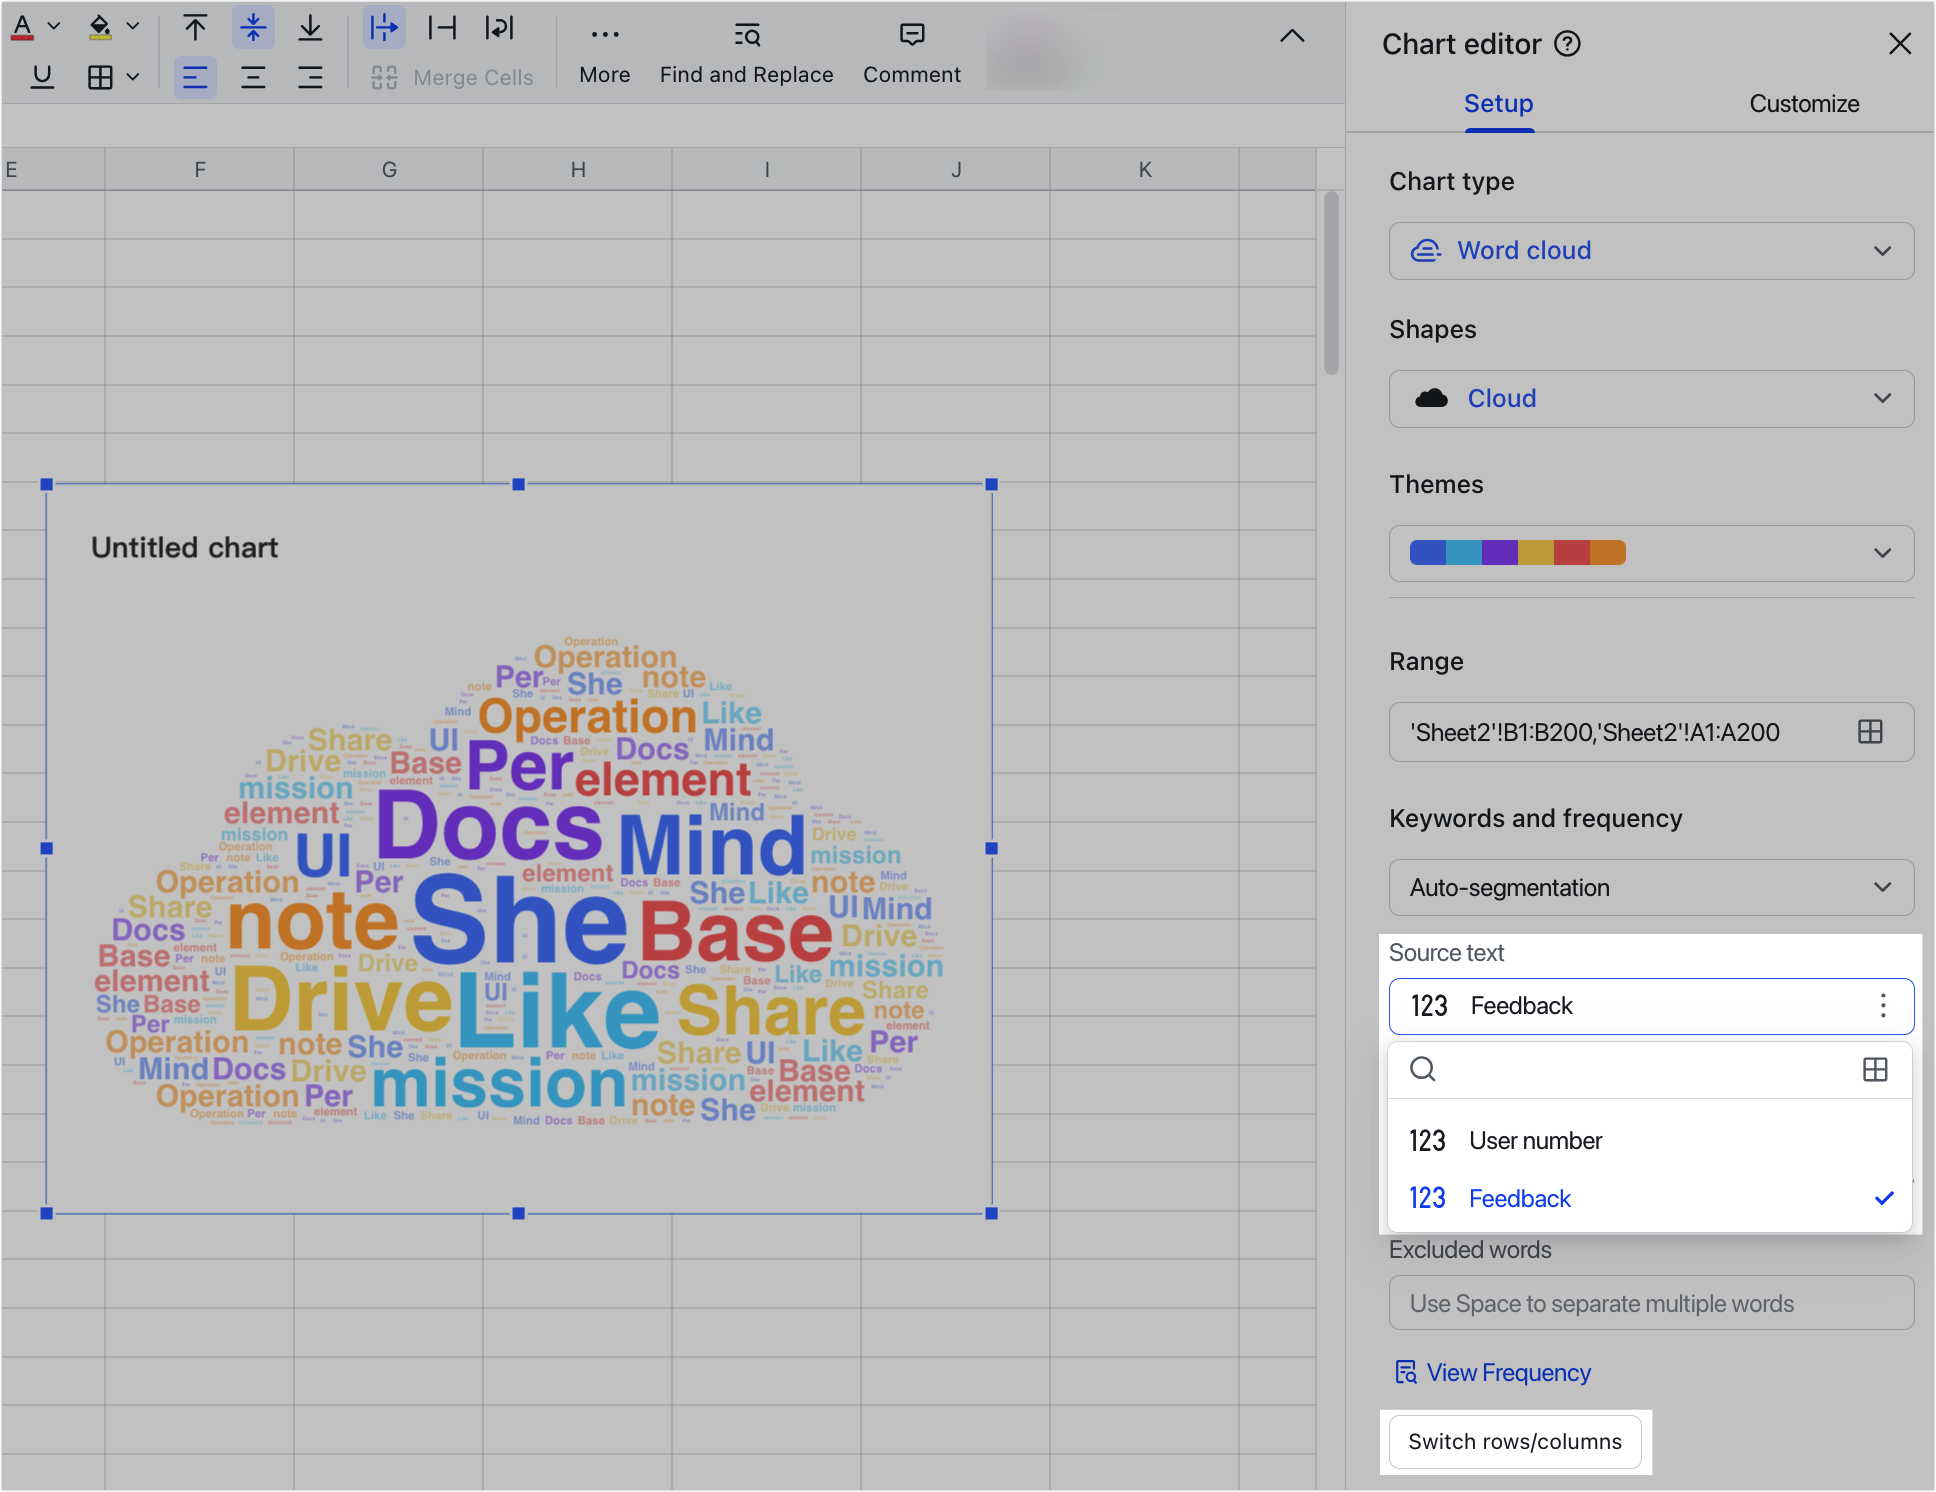
250px|700px|reset
Custom frequency
This mode is suitable for visualizing content of which the frequency has already been counted.
In this mode, select your words (text or date format) under Keywords and click the︙icon > Edit under Frequency to select the frequency for the words. The word cloud will display words based on specified frequency without automatic word segmentation.
Click Switch rows/columns to autofit the data used by the word cloud according to the data range you selected. This means if you are currently using row data, column data will be used instead when you click Switch rows/columns, and vice versa.
Note: Custom frequency mode supports displaying content in text or date format only.
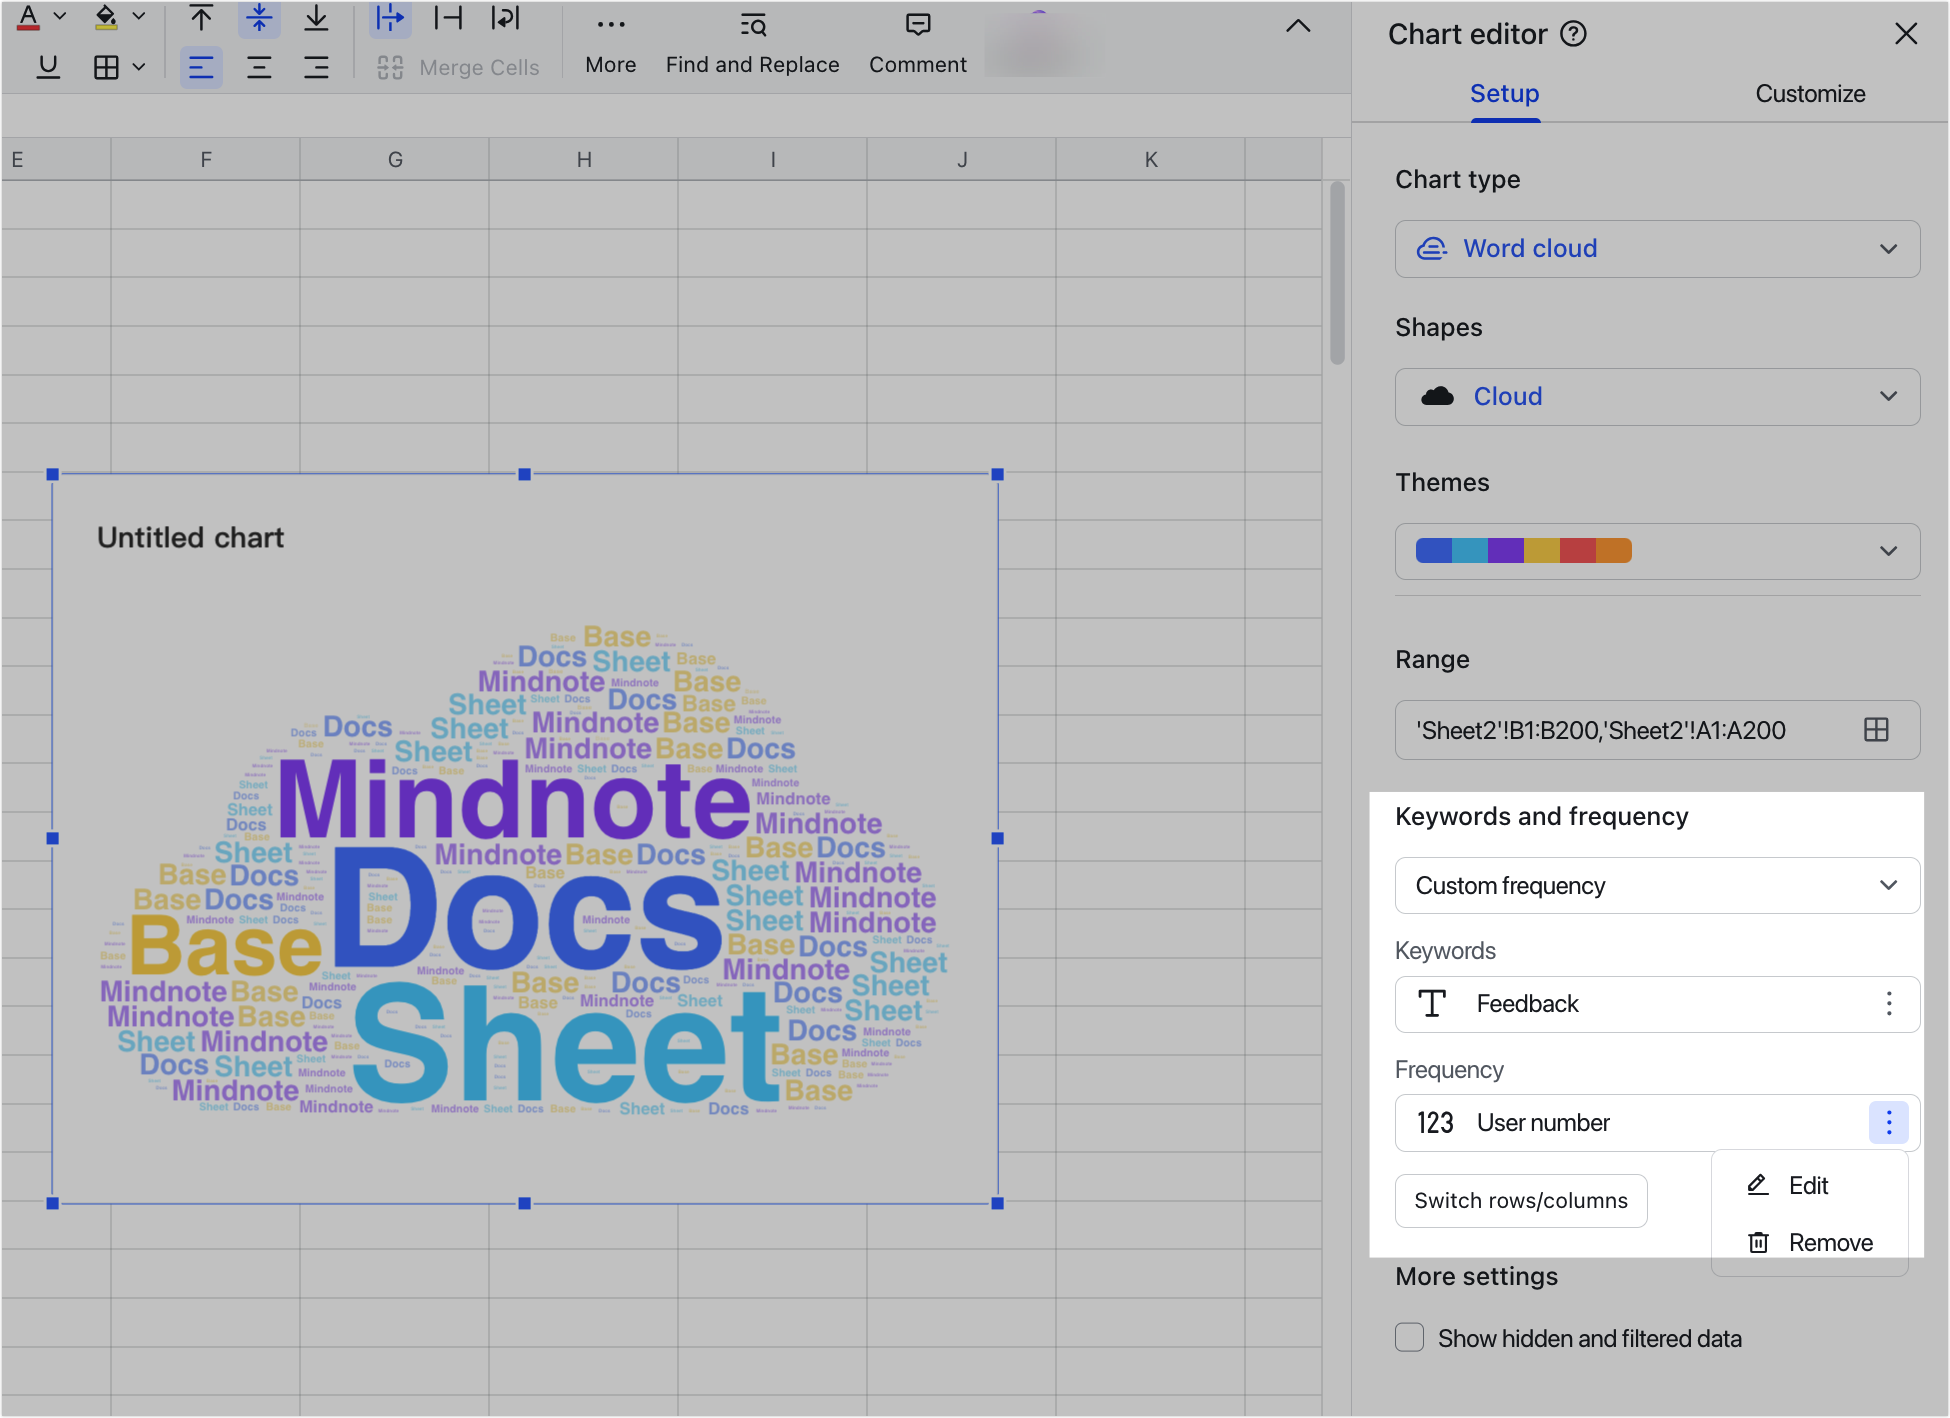
250px|700px|reset
Examples
- More settings
- Display hidden and filtered data: In Setup, select Display hidden and filtered data to show data that has been hidden or filtered out.
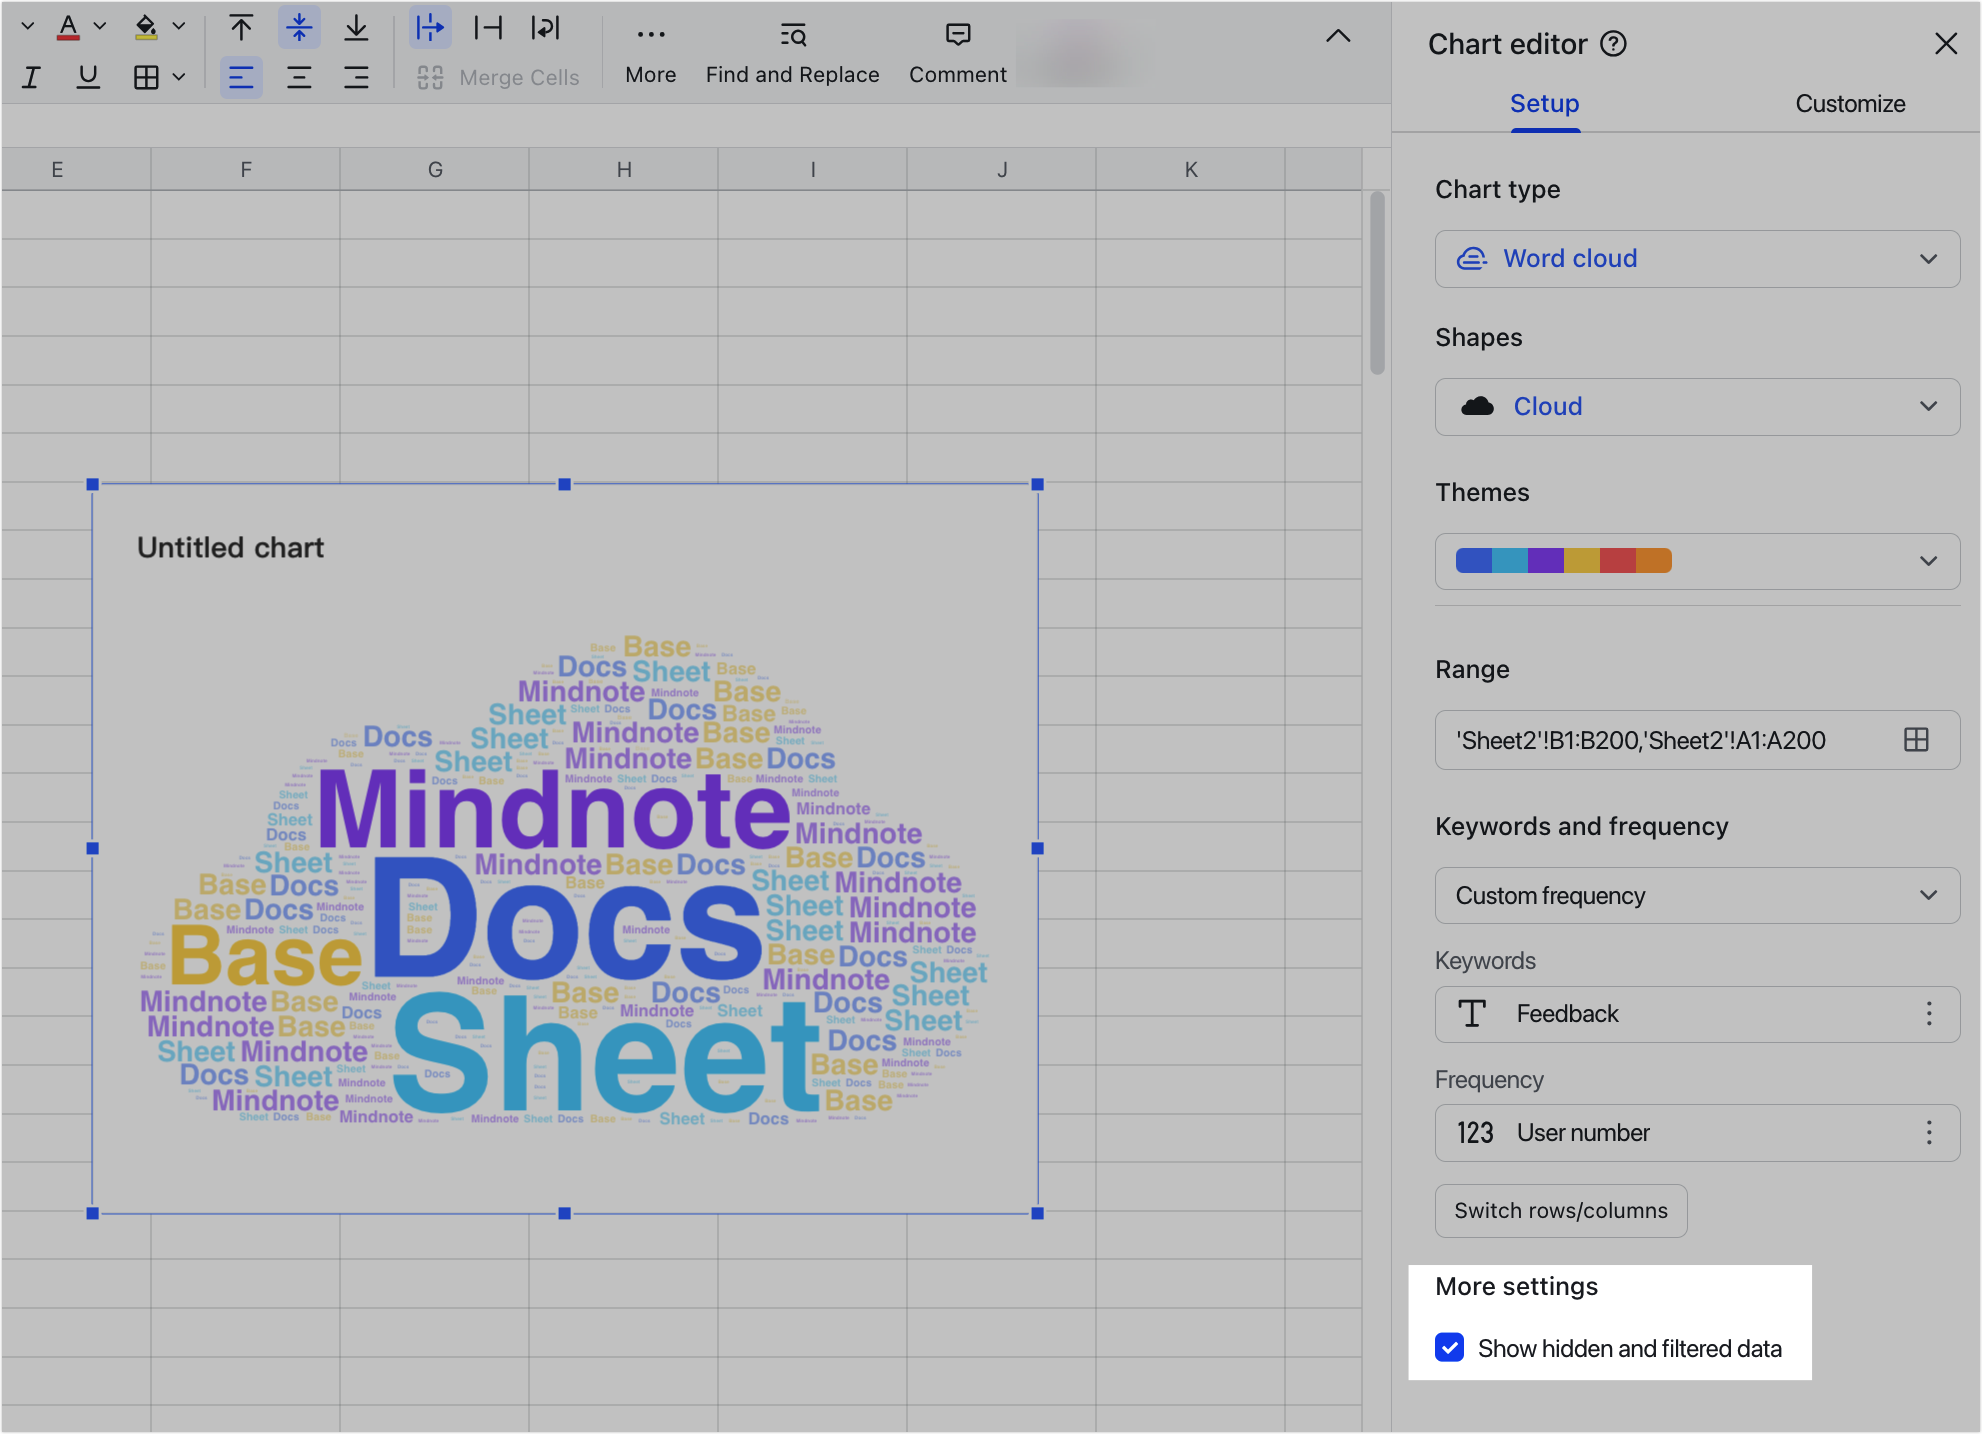
250px|700px|reset
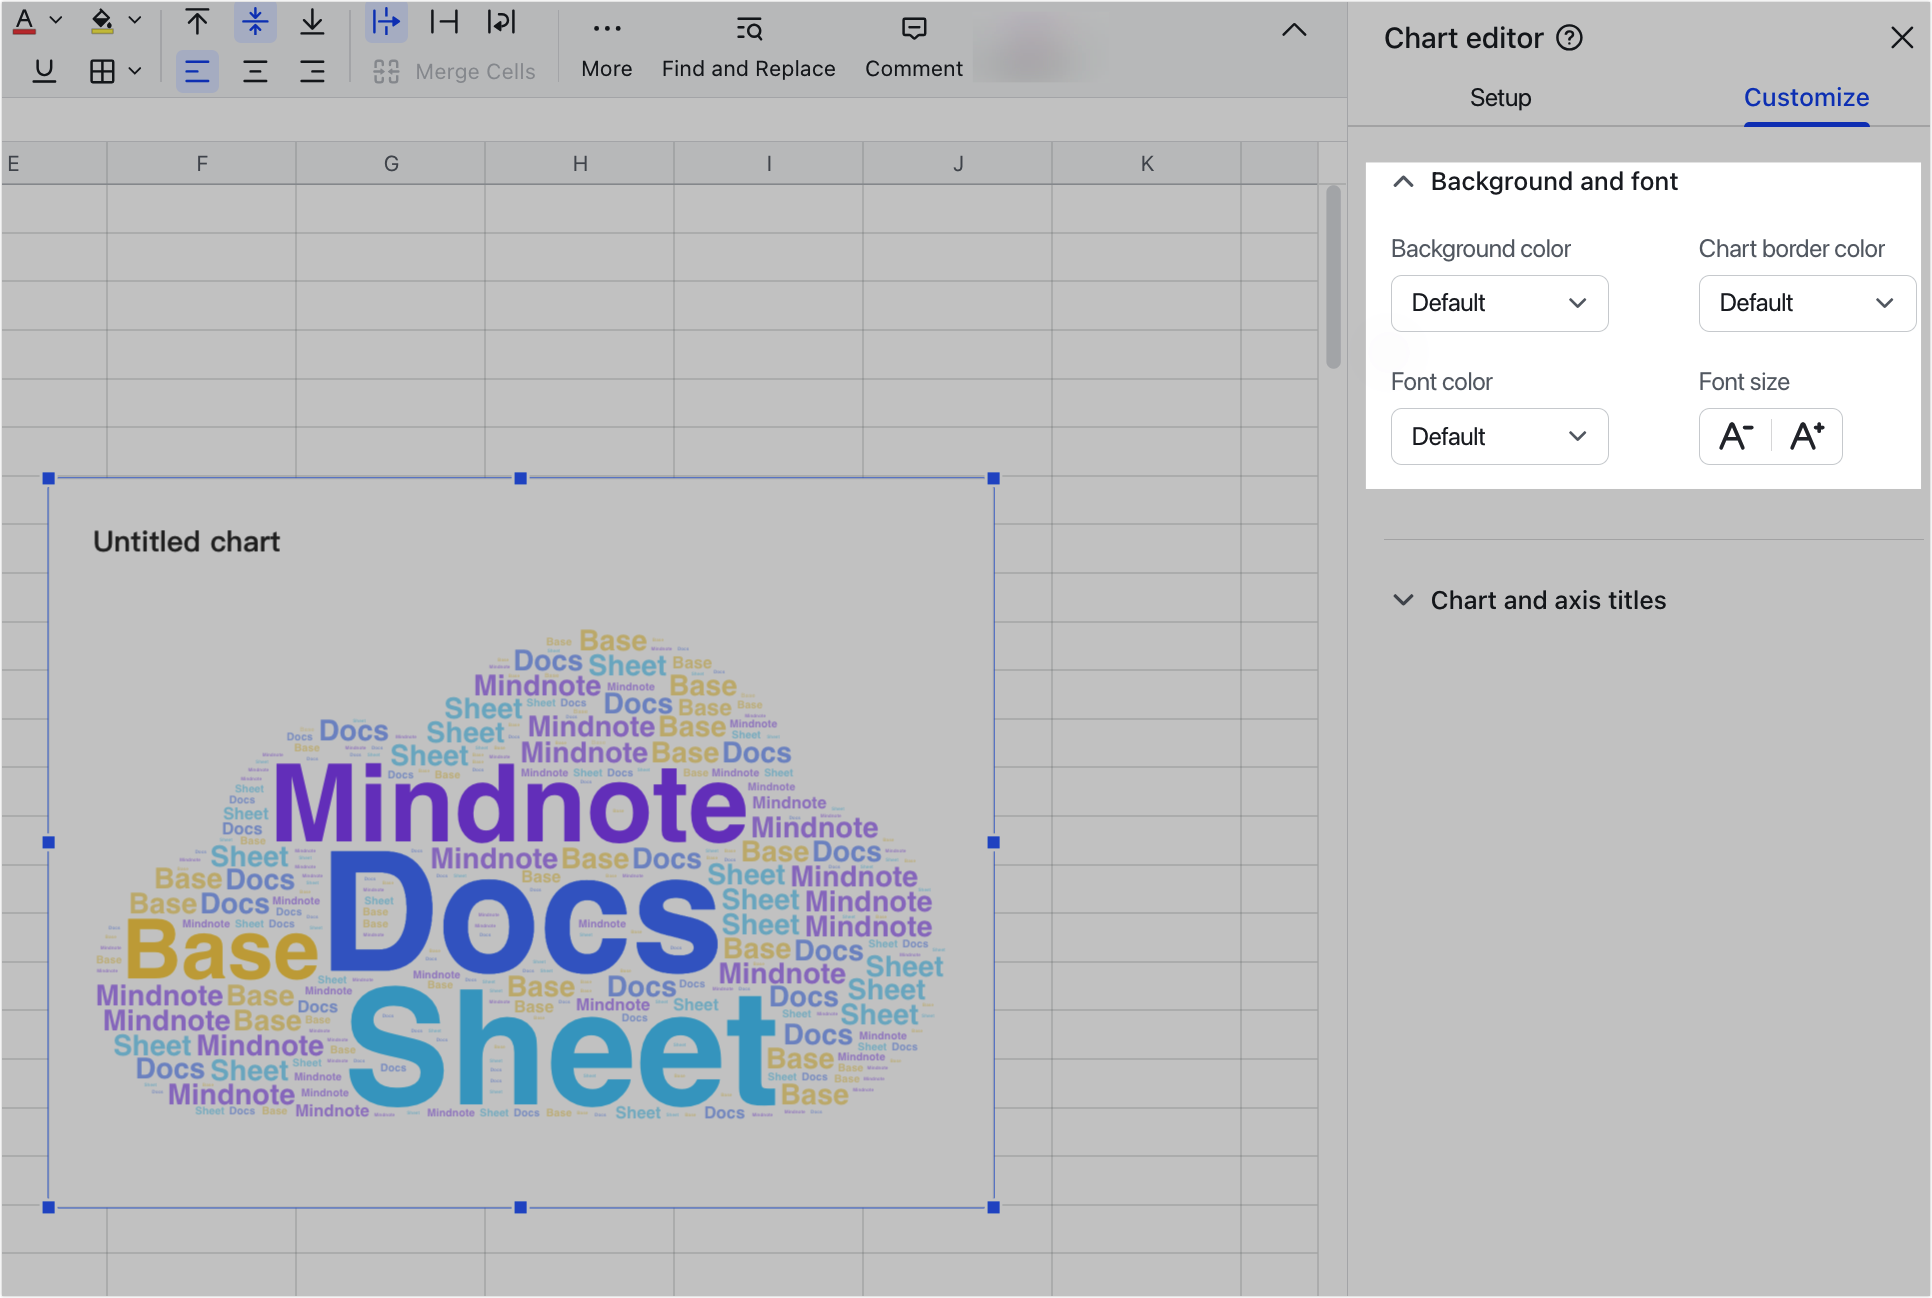
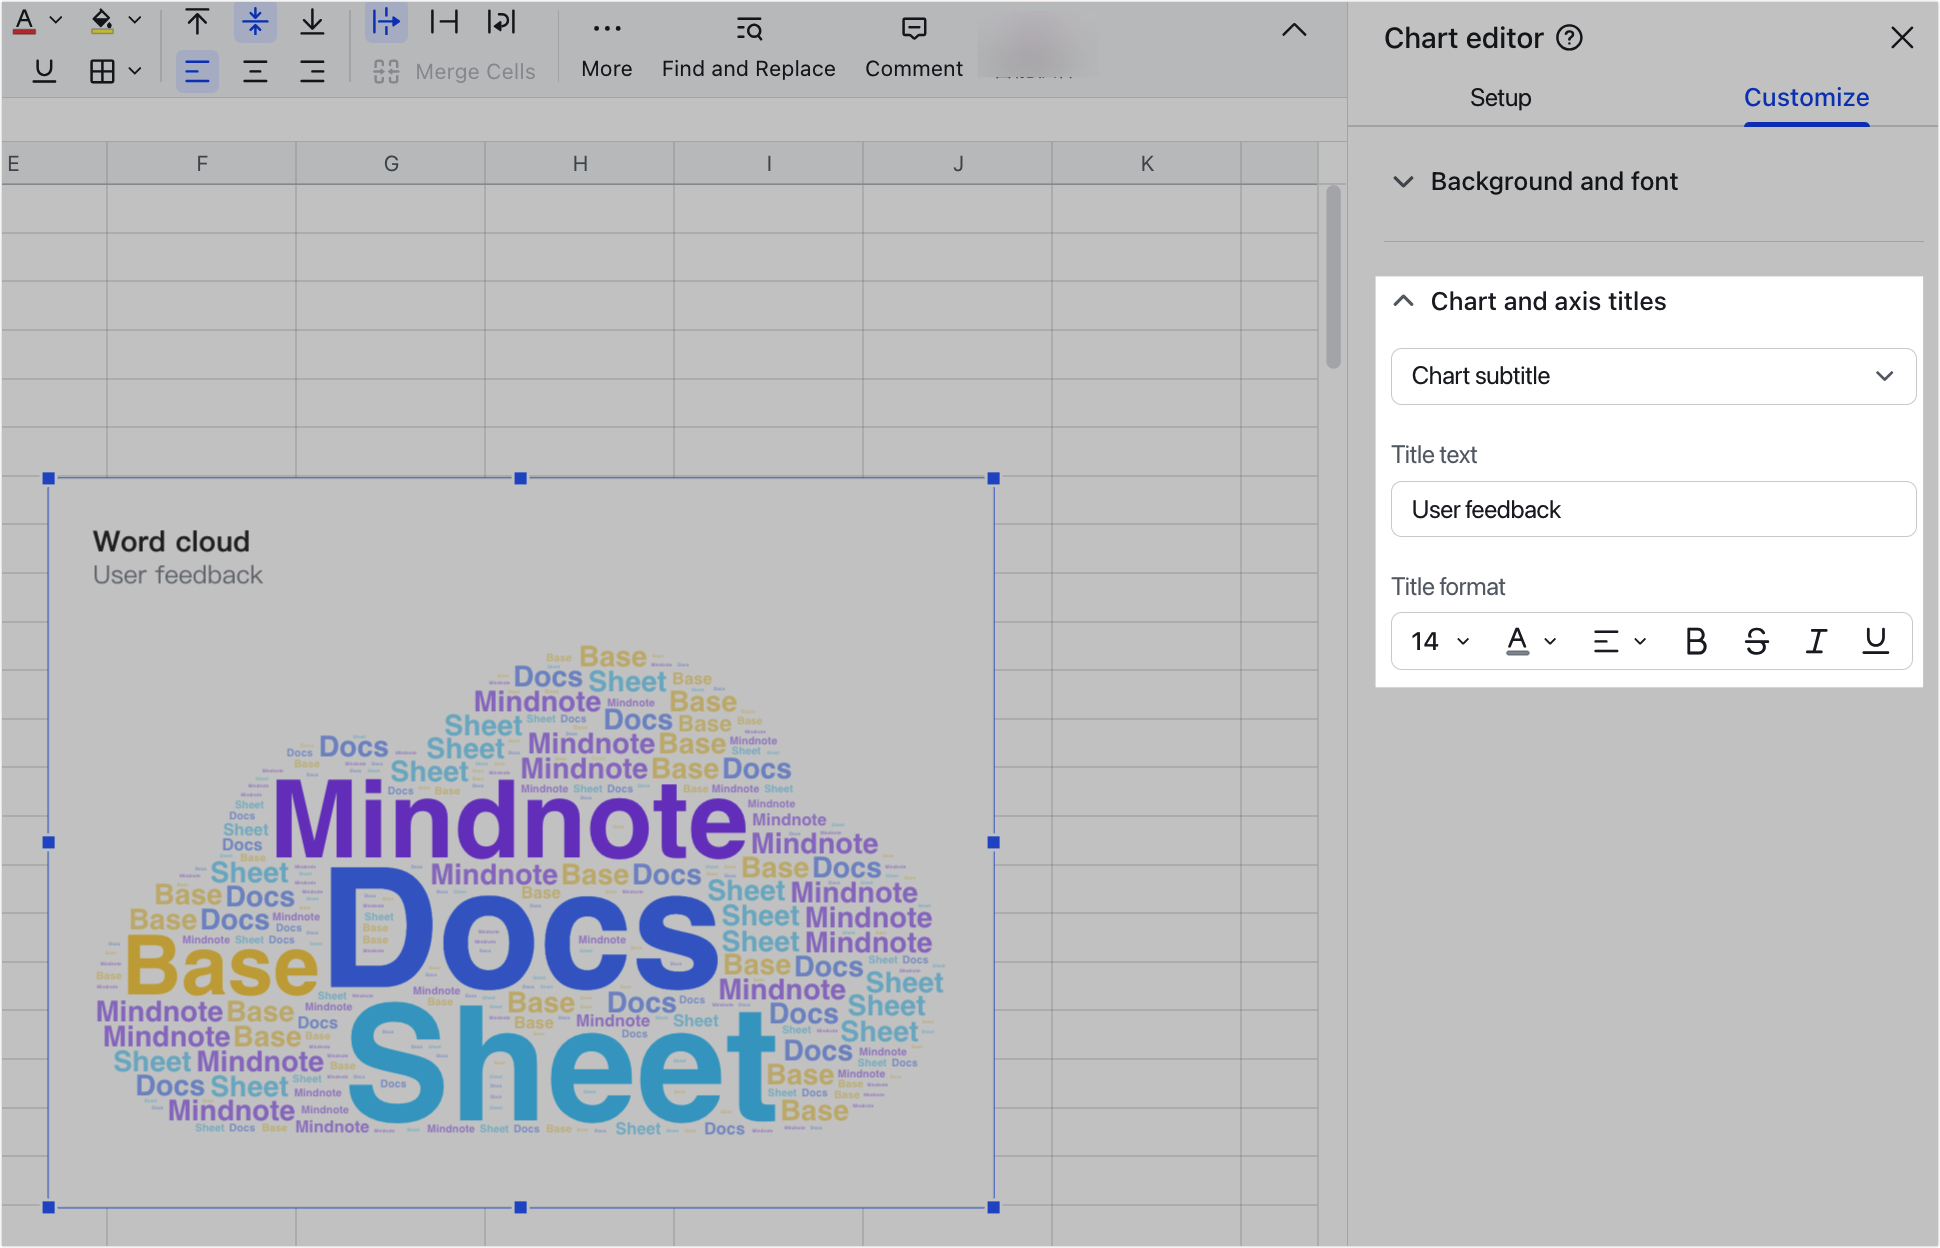
- Customize the chart: Click Customize at the top of the Chart editor pane to configure the background and font settings as well as the title and subtitle for the chart.
250px|700px|reset
250px|700px|reset
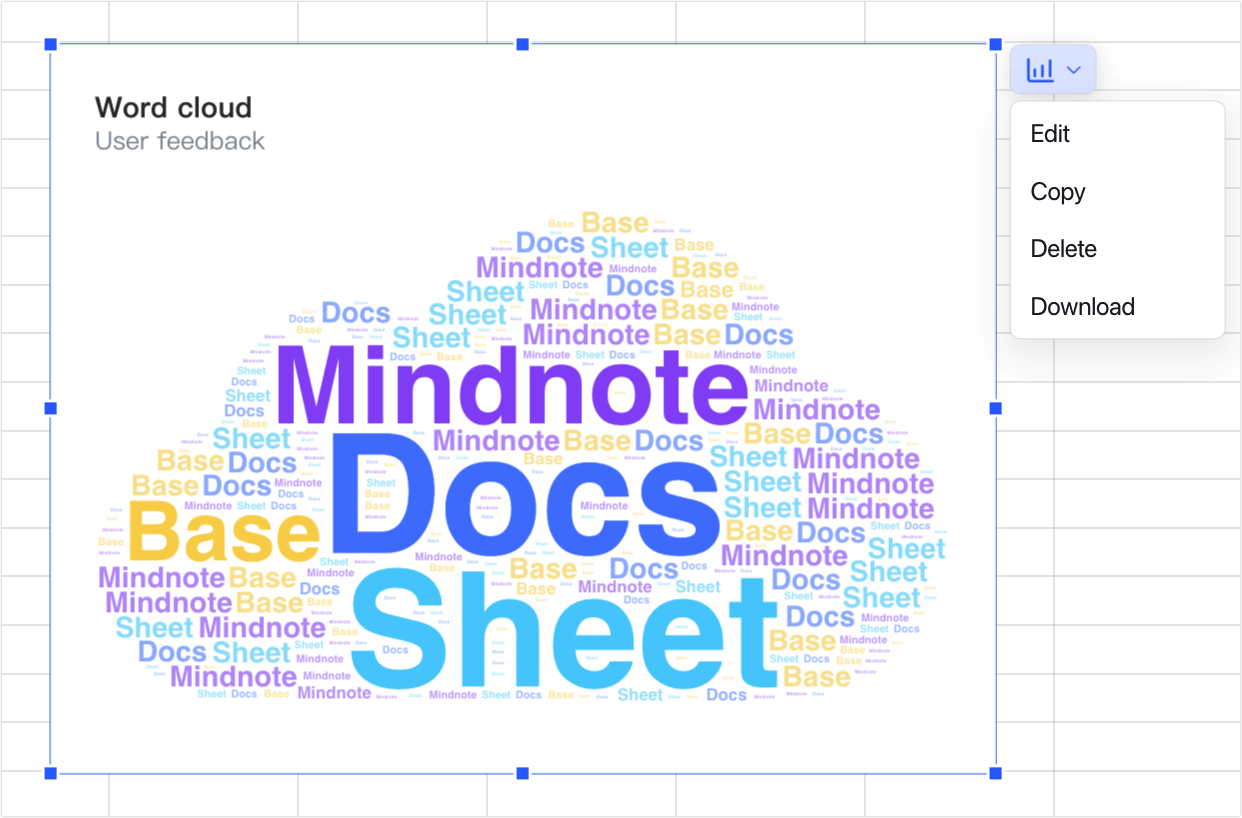
- Other chart actions: Right click the chart to bring up options to edit, copy, delete, and download the chart as an image in the upper-right corner.
250px|700px|reset
III. FAQs

