
I. Intro
Who can perform these steps: Help Desk administrators.
With Help Desk Report, administrators can obtain a comprehensive and detailed understanding of Help Desk ticket trends, agent performance, FAQ quality, and satisfaction rates. Therefore, the administrator can make data-driven decisions to manage agents more efficiently and improve the overall FAQ quality.
II. Steps
View ticket trend
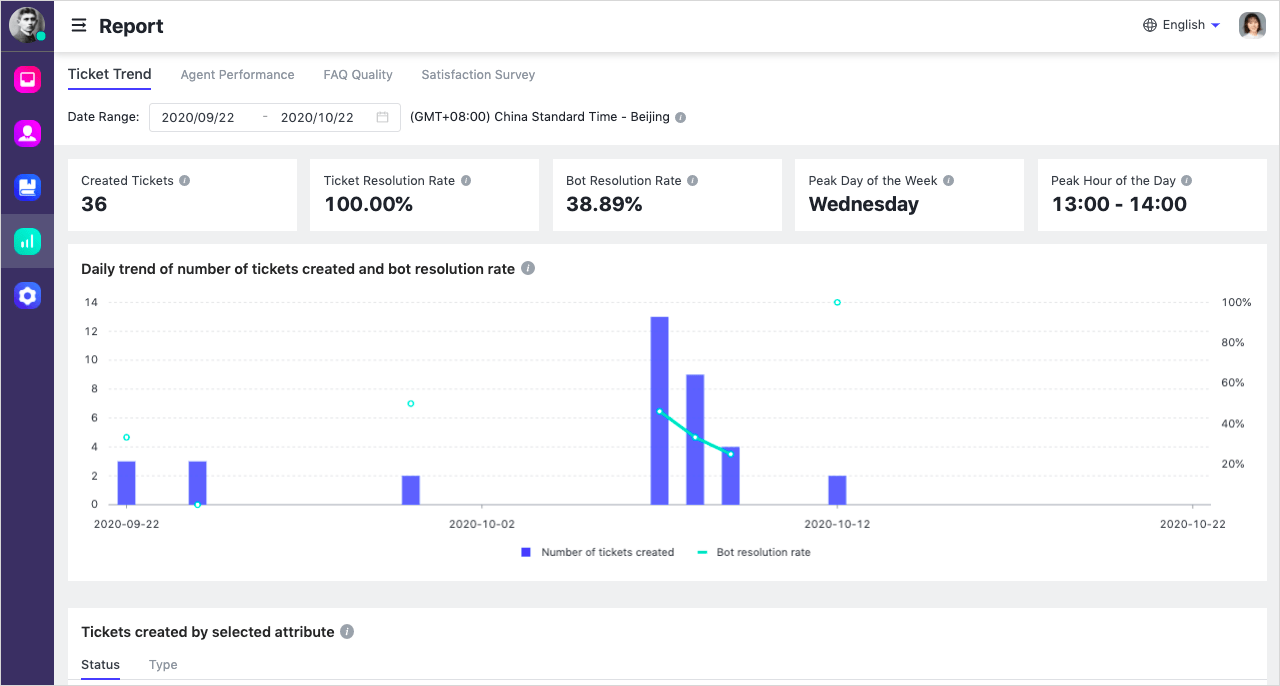
Click Report on the left side navigation bar on Help Desk. Click Ticket Trend at the top of the page, and select the time period to view the number of created tickets, ticket resolution rate, bot resolution rate, and the relevant data such as daily trend, weekly trend, label distribution and user city distribution.
Note: You can use Date Range in the upper-left corner of the Report page to specify the date range of the data. When you first view the report, the data of the last 30 days will be displayed by default.
250px|700px|reset
The page contains the following metrics:
- Tickets Created: Total number of tickets created during the selected date range.
- Ticket Resolution Rate: Number of tickets created and closed / number of tickets created (during the selected date range).
- Bot Resolution Rate: Number of bot tickets created and closed / number of tickets created (during the selected date range).
- Peak Day of the Week: Day of the week with the highest average number of tickets created, during the selected date range.
- Peak Hour of the Day: Hour of the day with the highest average number of tickets created, during the selected date range.
- Daily trend of number of tickets created and bot resolution rate: Daily bot resolution rate only calculates the percentage of bot tickets created and closed over tickets created on a particular date. A bot ticket created on a day but closed the next day is not counted towards the bot resolution rate on both days.
- Tickets created by selected attribute: Pie chart shows the overall distribution at the end of the selected period. Stacked bar chart shows the daily distribution during the selected date range.
- Tickets created by ticket tag: The 10 most frequently used tags for created tickets within the selected time period. You can click Download Details to view the distribution of all tags used for tickets created during the time period. You can go to the Help Desk admin console and click Settings > Tags to create tags. Agents can then add tickets to tickets.
- Tickets created by user city: The 10 most common user cities for created tickets within the selected time period. User city refers to the work city set by the organization administrator for the user in the Lark Admin Console, not the user's geographic location. If the city is not displayed, it means the user's city information could not be obtained. If the same user has multiple tickets created within the selected time period, their city will be counted multiple times. Click Download Details to view the distribution of all user cities for tickets created during the time period.
- Daily average number of tickets created during the week: The average number of tickets created on each day, from Monday to Sunday, during the selected time period.
- Hourly average number of tickets created during the day: The average number of tickets created within hours, from 0:00 to 24:00, during the selected time period.
View agent performance
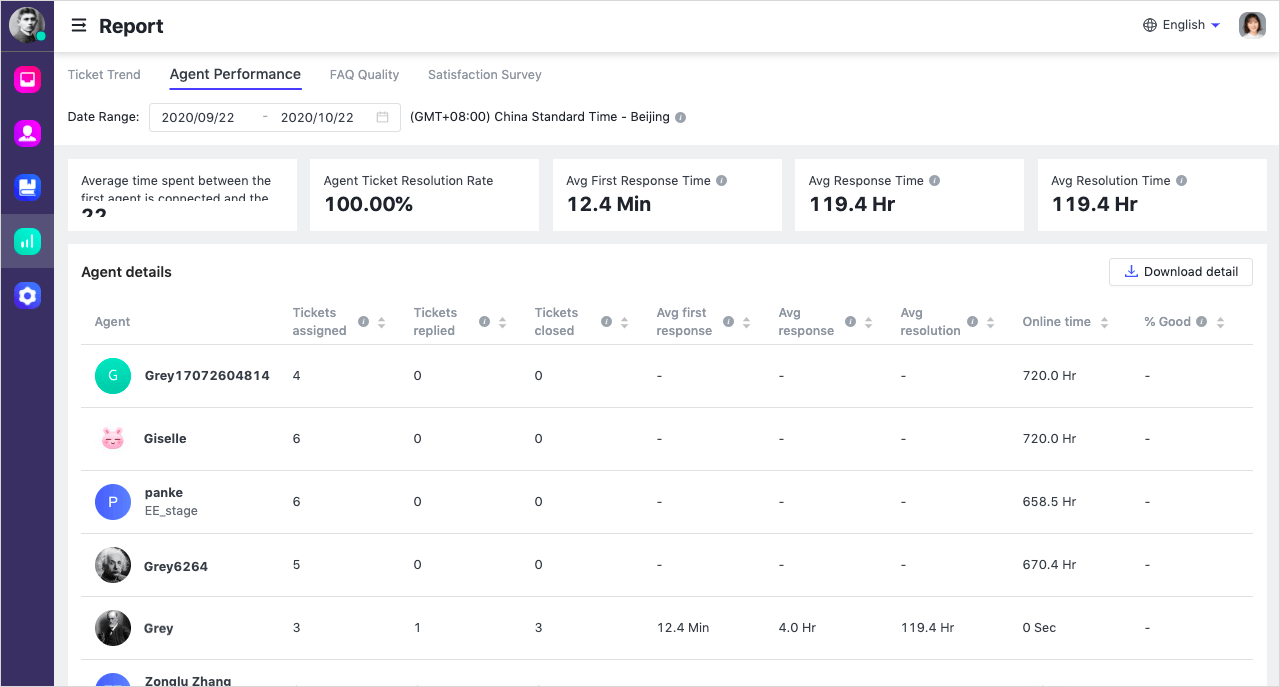
Click Agent Performance at the top of the page and select the time period to view the number of agent tickets and resolution rate. Click Download Detail in the upper-right corner to download agent performance data as a local excel file.
250px|700px|reset
The page contains the following metrics:
- Overall data
- Agent Tickets: The total number of manual tickets created during the selected time period.
- Agent Ticket Resolution Rate: The number of tickets created and closed / the number of tickets created.
- Avg First Response Time: Average time spent between the first agent connecting and the first reply to the ticket being sent.
- Avg Response Time: Average time spent between a user asking a question and an agent replying.
- Avg Resolution Time: Average time spent between the first agent connecting and the ticket closing.
- Agent data
- Tickets assigned: The number of tickets assigned to the agent during the selected date range.
- Tickets replied: The number of tickets assigned to and replied by the agent during the selected date range.
- Tickets closed: The number of tickets closed by the agent or user during the selected time period (tickets not included in the group are not included in the statistics).
- Avg first response: The total first response time of this agent during the selected time period / the number of first response tickets.
- Avg response: The total response time of this agent during the selected time period / the number of responses.
- Avg resolution: The total resolution time of each ticket of this agent during the selected time period / the number of ended tickets.
- Online time: The total online duration of the agent within the selected time period. The online and offline status of the agent is automatically updated according to the business hours of the help desk and the agent's shift time. Agents can only manually modify their status during the help desk's business hours.
- % Satisfaction: The number of tickets rated a good during the selected period compared to the number of assigned tickets that completed the satisfaction survey.
View FAQ quality
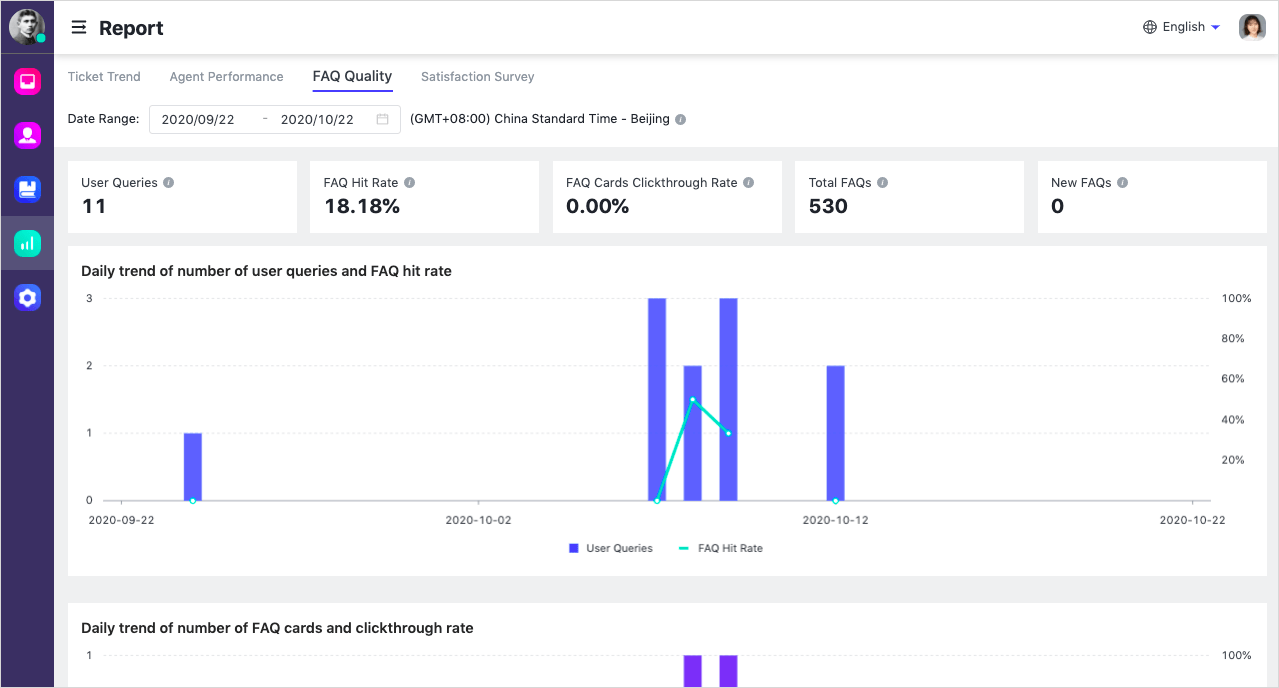
Click FAQ Quality at the top of the page and select the time period to view the number of user queries, FAQ hit rate, FAQ card clickthrough rate, as well as relevant data such as daily trends, weekly trends and popular keywords.
250px|700px|reset
The page contains the following metrics:
- User Queries: Number of questions asked by users before agent service, excluding clicking of categories and FAQs.
- FAQ Hit Rate: Number of user queries that hit at least one FAQ / Number of user queries.
- FAQ Cards Clickthrough Rate: Number of FAQ cards with at least a click on any FAQ / Number of FAQ cards shown.
- Total FAQs: Total number of FAQs in the database at the end of the selected date range.
- New FAQs: Number of new FAQs added during the selected date range.
- Daily trend of number of user queries and FAQ hit rate: The trend of the daily number of user queries and the FAQ hit rate.
- Daily trend of number of FAQ cards and clickthrough rate: The trend of the number of FAQ cards sent after a query is hit and the clickthrough rate of the cards each day.
- FAQs Questions Details: You can view the display, clicks, and transfer count in the FAQs by Question and Question Category.
- Top keyword clusters from user queries: Using natural language processing (NLP) algorithms, user queries are categorized based on semantic similarity, and keywords in similar queries are analyzed. The same keyword may appear in different categories. Only preset time periods can be selected on this chart, that is, the previous 30 days, 7 days, or 1 day counting from the last day of the currently selected time period.
- Top 10 Hit Keywords: Top 10 keywords extracted from similar user queries that return at least one FAQ match. Click Download Details to view corresponding user queries, the hit questions, and the user clicks. If the user does not click any question or directly transfers to an agent, it may indicate that the returned questions are not what the user asked. You can optimize the description of the questions or create new questions based on the user queries. If the user still chooses to transfer to an agent after clicking a question to view the answer, it may indicate that the answer itself did not help the user solve the problem, and the answer can be optimized.
- Top 10 Missed Keywords: Keywords extracted from similar user queries that do not return any FAQ matches. Click Download Details to view corresponding user queries. New questions can be created based on these keywords to improve the hit rate.
Note: If no keywords are displayed, it may be due to a delay in updates. Try adjusting the end date of the selected data range by moving it back 2 days. If it still does not display, it may be due to insufficient valid data. For example, queries composed mainly of modal particles may not be included in the keyword analysis.
View satisfaction survey
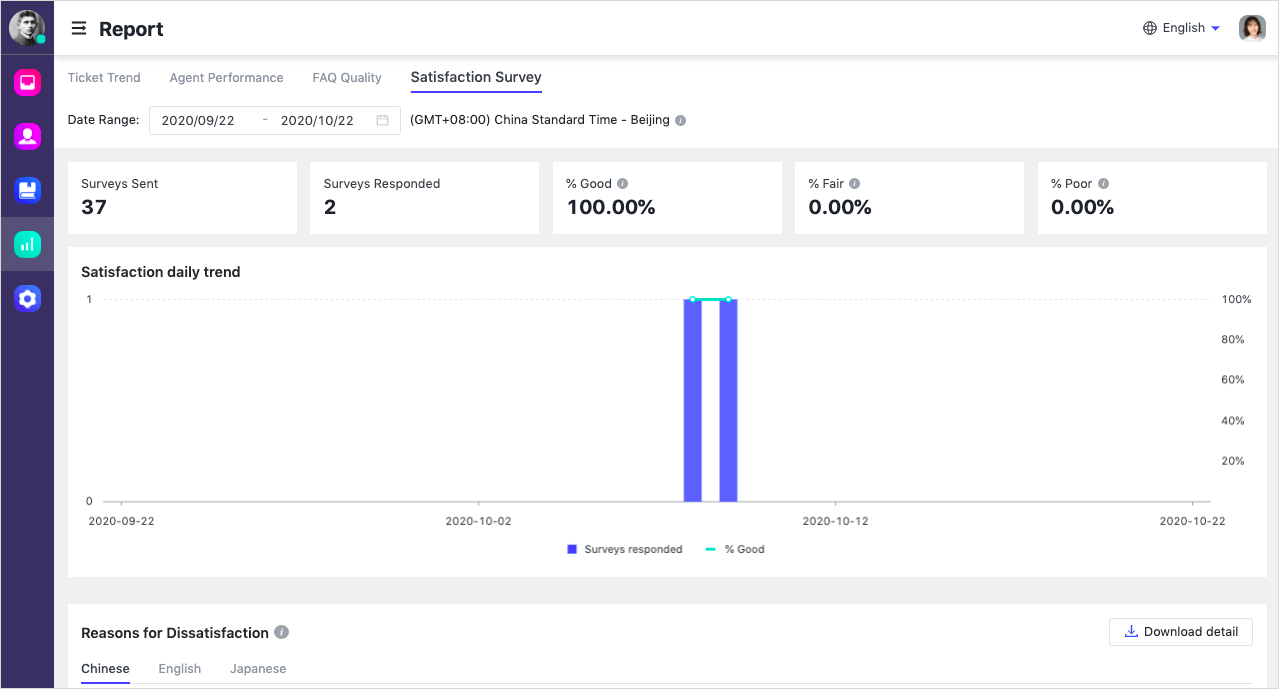
Click Satisfaction Survey at the top of the page to view the number of sent and responded surveys and how the users rate the service. You can also learn why users are dissatisfied and download it as a local excel file.
250px|700px|reset
Key metrics definition:
Surveys Sent: The number of tickets for which satisfaction surveys have been sent within the selected time period. If the satisfaction survey is enabled, a survey is automatically sent to users after the completion of both agent and bot tickets.
Surveys Responded: The number of tickets for which users completed the satisfaction survey out of the total number of surveys sent within the selected time period.
% Good: Number of tickets rated "good" / Number of surveys responded.
% Fair: Number of tickets rated "fair" / Number of surveys responded.
% Poor: Number of tickets rated "poor" / Number of surveys responded.
Satisfaction daily trend: The number of surveys completed per day / the number of tickets rated as Good within the selected time period. Move the cursor over the bar chart to view the specific number of tickets for each evaluation.
Reasons for dissatisfaction: Statistics of the reasons for dissatisfaction selected by users. To view the details of tickets with dissatisfaction, click Ticket Center > View Details > Ticket Info. If this feature has not been enabled, click Settings > Agent Service Feedback to complete the configuration.
III. FAQs